On the other hand, the pair has just violated the falling resistance line that was meant to guide the price south. Given that the market is overbought (73% of open positions are long), however, the bias is slightly to the downside, but we need the exchange rate either to fall below 0.71 or rise above the 200-day SMA at 0.7450 in order to state its further intentions.
Note: This section contains information in English only.
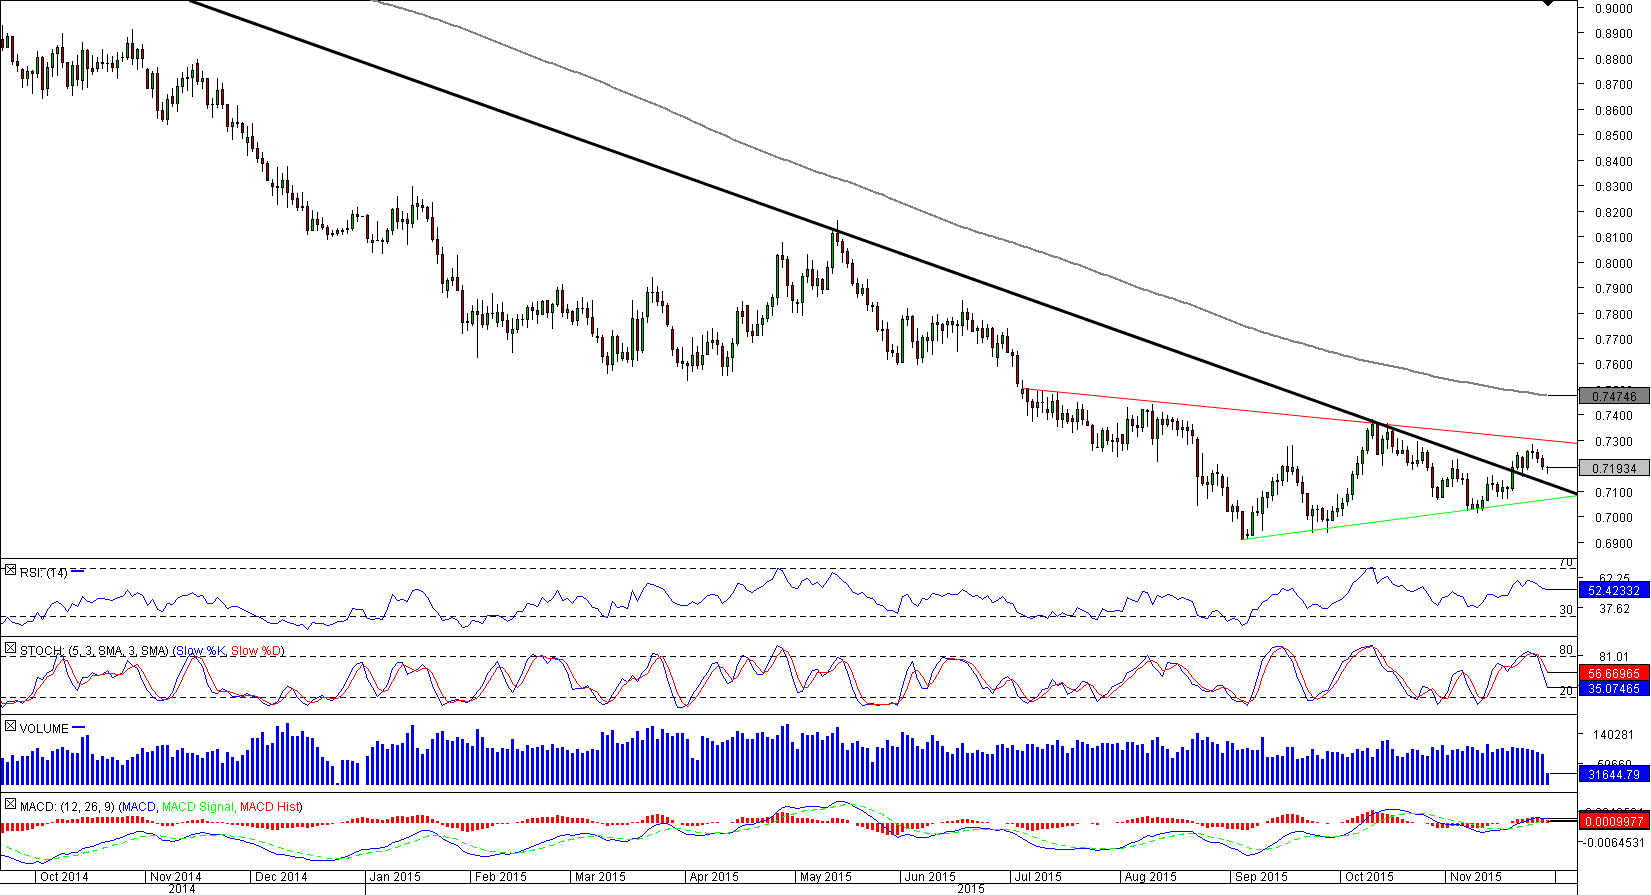
 The situation with AUD/USD is ambiguous at the moment. From one side, the currency pair is forming a symmetrical triangle, which in this case is bearish because we are in a distinct down-trend (since mid-April of 2013), and the weekly and monthly technical indicators are mostly giving ‘sell' signals.
On the other hand, the pair has just violated the falling resistance line that was meant to guide the price south. Given that the market is overbought (73% of open positions are long), however, the bias is slightly to the downside, but we need the exchange rate either to fall below 0.71 or rise above the 200-day SMA at 0.7450 in order to state its further intentions.

Mon, 30 Nov 2015 08:20:12 GMT
Source: Dukascopy Bank SA
© Dukascopy Bank SA
On the other hand, the pair has just violated the falling resistance line that was meant to guide the price south. Given that the market is overbought (73% of open positions are long), however, the bias is slightly to the downside, but we need the exchange rate either to fall below 0.71 or rise above the 200-day SMA at 0.7450 in order to state its further intentions.
© Dukascopy Bank SA
Actual Topics
Subscribe to "Fundamental Analysis" feed
订阅
欲了解更多有关杜高斯贝银行差价合约/外汇交易平台,SWFX和其它相关交易详情,
请致电我们或要求回电。
请致电我们或要求回电。
For further information regarding potential cooperation,
please call us or make callback request.
please call us or make callback request.
To learn more about Dukascopy Bank Binary Options
/ Forex trading platform, SWFX and other trading related information,
please call us or make callback request.
please call us or make callback request.
欲了解更多有关杜高斯贝银行差价合约/外汇交易平台,SWFX和其它相关交易详情,
请致电我们或要求回电。
请致电我们或要求回电。
To learn more about Crypto Trading / CFD / Forex trading platform, SWFX and other trading related information,
please call us or make callback request.
please call us or make callback request.
To learn more about Business Introducer and other trading related information,
please call us or make callback request.
please call us or make callback request.
For further information regarding potential cooperation,
please call us or make callback request.
please call us or make callback request.