Note: This section contains information in English only.


Thu, 17 Jul 2014 14:37:17 GMT
Source: Dukascopy Bank SA
© Dukascopy Bank SA
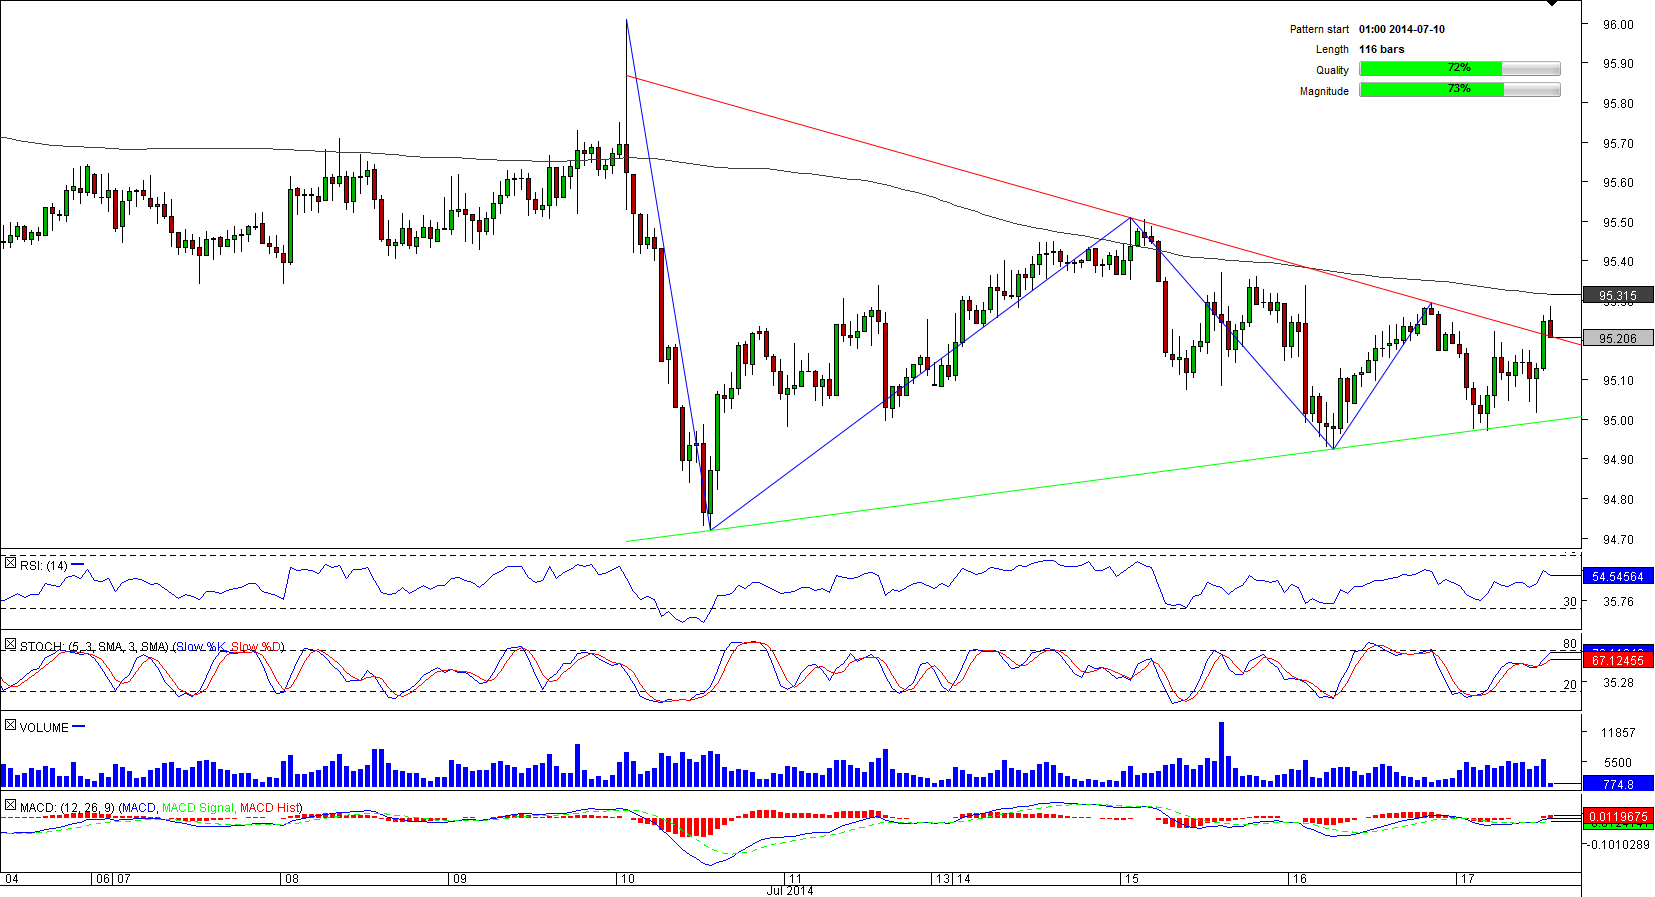
After increased volatility seen a week ago the Aussie started to calm down, which has eventually led to formation of a symmetrical triangle. However, despite the ‘sell' signals on all relevant time-frames, the currency pair seems to be already willing to break-out from the pattern to the upside.
If this is the case, the first resistance the price will encounter is going to be 95.37—a combination of the daily R1 and 200-hour SMA. The next obstacle is supposed to be the Jul 15 high and daily R2 at 95.56. Meanwhile, the SWFX market is almost equally divided between the bullish (52%) and bearish (48%) traders.
© Dukascopy Bank SA
Actual Topics
Subscribe to "Fundamental Analysis" feed
订阅
欲了解更多有关杜高斯贝银行差价合约/外汇交易平台,SWFX和其它相关交易详情,
请致电我们或要求回电。
请致电我们或要求回电。
For further information regarding potential cooperation,
please call us or make callback request.
please call us or make callback request.
To learn more about Dukascopy Bank Binary Options
/ Forex trading platform, SWFX and other trading related information,
please call us or make callback request.
please call us or make callback request.
欲了解更多有关杜高斯贝银行差价合约/外汇交易平台,SWFX和其它相关交易详情,
请致电我们或要求回电。
请致电我们或要求回电。
To learn more about Crypto Trading / CFD / Forex trading platform, SWFX and other trading related information,
please call us or make callback request.
please call us or make callback request.
To learn more about Business Introducer and other trading related information,
please call us or make callback request.
please call us or make callback request.
For further information regarding potential cooperation,
please call us or make callback request.
please call us or make callback request.