XAU/USD has recently breached the pattern's support at 1,283.56 but a breakout did not follow as the yellow metal managed to return to the triangle area. In the hours to come, gold is likely to gain more ground given that almost 70% of traders at the SWFX are bullish on the instrument. Dwelling on the potential advance, we add that proximity of the apex may even turn the expected jump into a bullish breakout.
Note: This section contains information in English only.
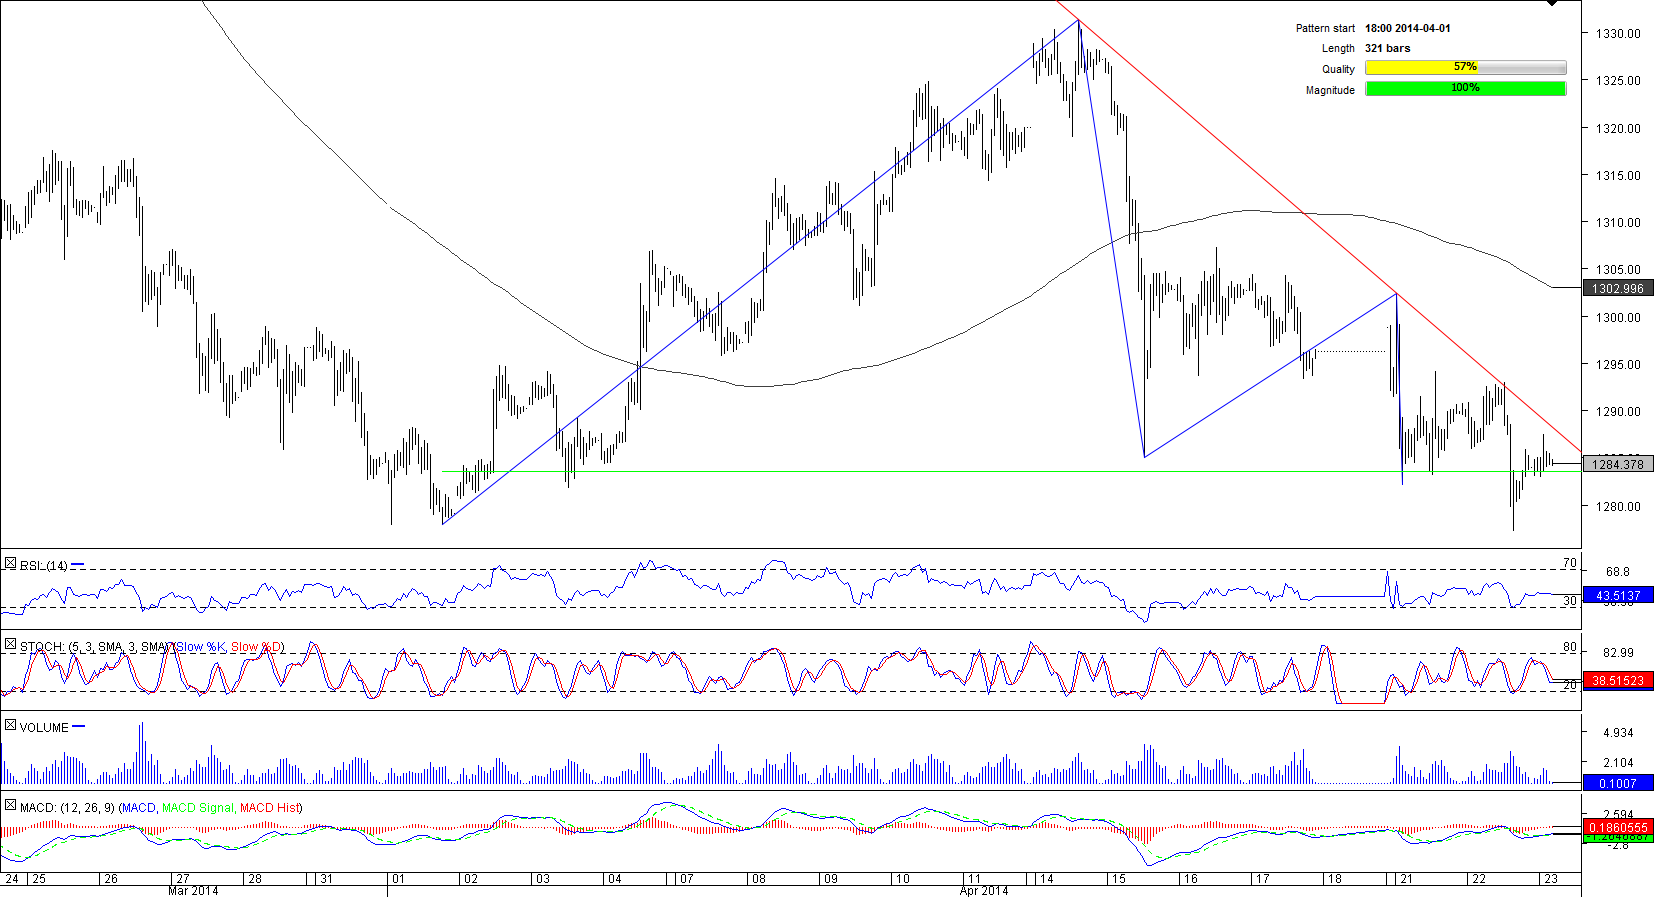
 The most traded precious metal has been in the down-trend since mid-March when it reached a six-month high of 1,390.00. Throughout the time of its weakness, the bullion shaped a 321-bar long descending triangle pattern.
XAU/USD has recently breached the pattern's support at 1,283.56 but a breakout did not follow as the yellow metal managed to return to the triangle area. In the hours to come, gold is likely to gain more ground given that almost 70% of traders at the SWFX are bullish on the instrument. Dwelling on the potential advance, we add that proximity of the apex may even turn the expected jump into a bullish breakout.

Wed, 23 Apr 2014 06:11:35 GMT
Source: Dukascopy Bank SA
© Dukascopy Bank SA
XAU/USD has recently breached the pattern's support at 1,283.56 but a breakout did not follow as the yellow metal managed to return to the triangle area. In the hours to come, gold is likely to gain more ground given that almost 70% of traders at the SWFX are bullish on the instrument. Dwelling on the potential advance, we add that proximity of the apex may even turn the expected jump into a bullish breakout.
© Dukascopy Bank SA
Actual Topics
Subscribe to "Fundamental Analysis" feed
订阅
欲了解更多有关杜高斯贝银行差价合约/外汇交易平台,SWFX和其它相关交易详情,
请致电我们或要求回电。
请致电我们或要求回电。
For further information regarding potential cooperation,
please call us or make callback request.
please call us or make callback request.
To learn more about Dukascopy Bank Binary Options
/ Forex trading platform, SWFX and other trading related information,
please call us or make callback request.
please call us or make callback request.
欲了解更多有关杜高斯贝银行差价合约/外汇交易平台,SWFX和其它相关交易详情,
请致电我们或要求回电。
请致电我们或要求回电。
To learn more about Crypto Trading / CFD / Forex trading platform, SWFX and other trading related information,
please call us or make callback request.
please call us or make callback request.
To learn more about Business Introducer and other trading related information,
please call us or make callback request.
please call us or make callback request.
For further information regarding potential cooperation,
please call us or make callback request.
please call us or make callback request.