Note: This section contains information in English only.
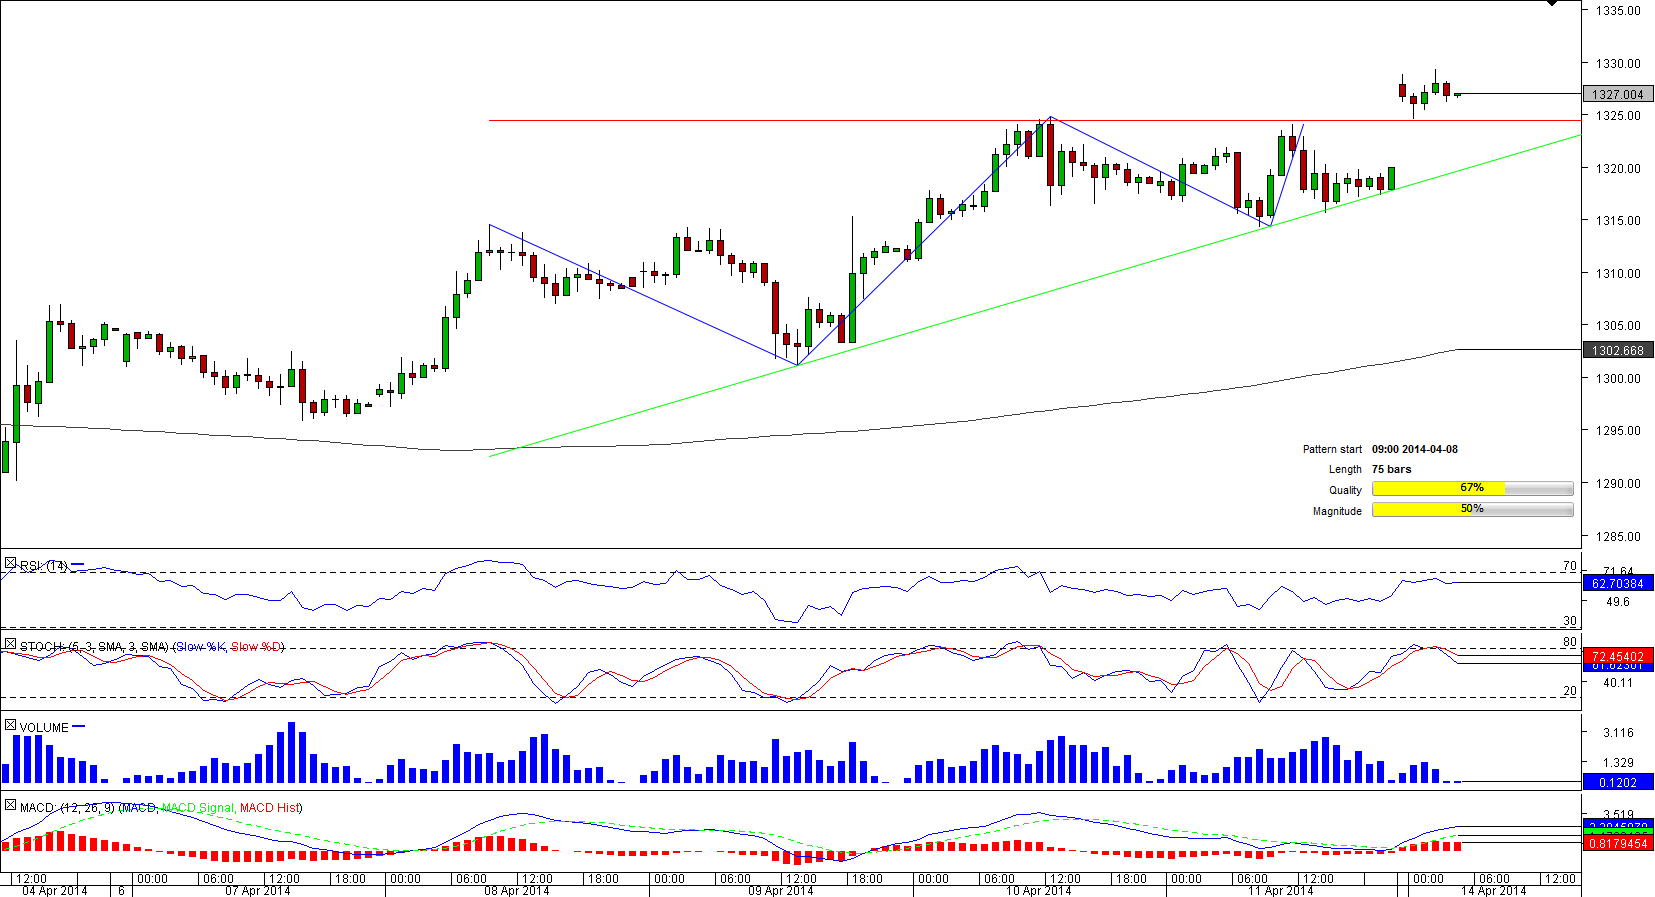
 After losing its value relative to the U.S. Dollar during more than two weeks ended April 1, the most traded precious metal started to appreciate. Although the rally has been lasting for almost two weeks, the yellow metal is not likely to halt it in the nearest future given that gold opened above the upper limit of the 75-bar long ascending triangle. This may mean that the breakout might have occurred. Market players support this idea, betting on appreciation of the metal in 67.80% of cases. Technical indicators also signal that buying pressure may be in place in the short-term.

Mon, 14 Apr 2014 09:22:21 GMT
Source: Dukascopy Bank SA
© Dukascopy Bank SA
© Dukascopy Bank SA
Actual Topics
Subscribe to "Fundamental Analysis" feed
订阅
欲了解更多有关杜高斯贝银行差价合约/外汇交易平台,SWFX和其它相关交易详情,
请致电我们或要求回电。
请致电我们或要求回电。
For further information regarding potential cooperation,
please call us or make callback request.
please call us or make callback request.
To learn more about Dukascopy Bank Binary Options
/ Forex trading platform, SWFX and other trading related information,
please call us or make callback request.
please call us or make callback request.
欲了解更多有关杜高斯贝银行差价合约/外汇交易平台,SWFX和其它相关交易详情,
请致电我们或要求回电。
请致电我们或要求回电。
To learn more about Crypto Trading / CFD / Forex trading platform, SWFX and other trading related information,
please call us or make callback request.
please call us or make callback request.
To learn more about Business Introducer and other trading related information,
please call us or make callback request.
please call us or make callback request.
For further information regarding potential cooperation,
please call us or make callback request.
please call us or make callback request.