Note: This section contains information in English only.
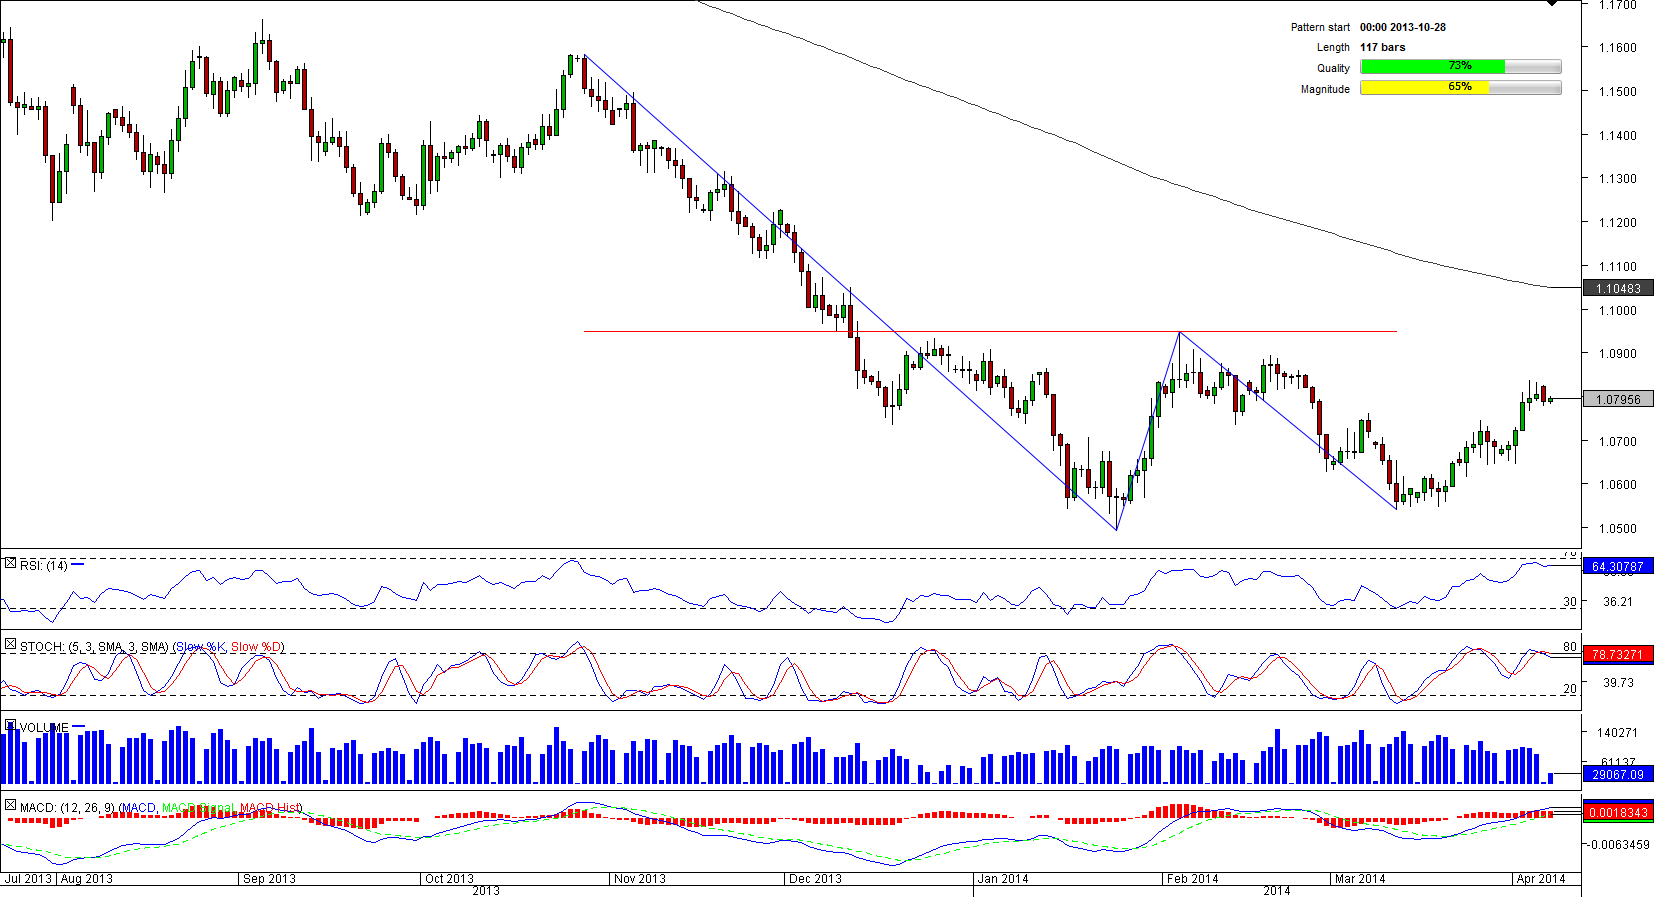
 Four weeks ago there were signs that AUD/NZD was forming a bearish channel. However, as the support at 1.0566 did not let the currency pair to extend the decline, there are now more reasons to believe in emergence of a double bottom pattern. In this case the key supply area is the neck-line at 1.0945. If the Aussie manages to breach it, the currency will have a good chance of reaching 1.1584 in the long term, although there are also the resistances represented by the monthly R3 and 200-day SMA at 1.1004 and 1.1056 respectively that we should be wary of. In the meantime, the technical indicators are mixed and do not support any particular scenario.

Mon, 07 Apr 2014 07:49:57 GMT
Source: Dukascopy Bank SA
© Dukascopy Bank SA
© Dukascopy Bank SA
Actual Topics
Subscribe to "Fundamental Analysis" feed
订阅
欲了解更多有关杜高斯贝银行差价合约/外汇交易平台,SWFX和其它相关交易详情,
请致电我们或要求回电。
请致电我们或要求回电。
For further information regarding potential cooperation,
please call us or make callback request.
please call us or make callback request.
To learn more about Dukascopy Bank Binary Options
/ Forex trading platform, SWFX and other trading related information,
please call us or make callback request.
please call us or make callback request.
欲了解更多有关杜高斯贝银行差价合约/外汇交易平台,SWFX和其它相关交易详情,
请致电我们或要求回电。
请致电我们或要求回电。
To learn more about Crypto Trading / CFD / Forex trading platform, SWFX and other trading related information,
please call us or make callback request.
please call us or make callback request.
To learn more about Business Introducer and other trading related information,
please call us or make callback request.
please call us or make callback request.
For further information regarding potential cooperation,
please call us or make callback request.
please call us or make callback request.