Currently, GBP/USD is trading below the 50-hour SMA at 1.6608. Meanwhile, traders and technical data fail to provide any hint on the future trend of the pair. The SWFX data shows that the proportion of long to short orders is almost 1:1, while technical indicators are sending mixed signals.
Note: This section contains information in English only.
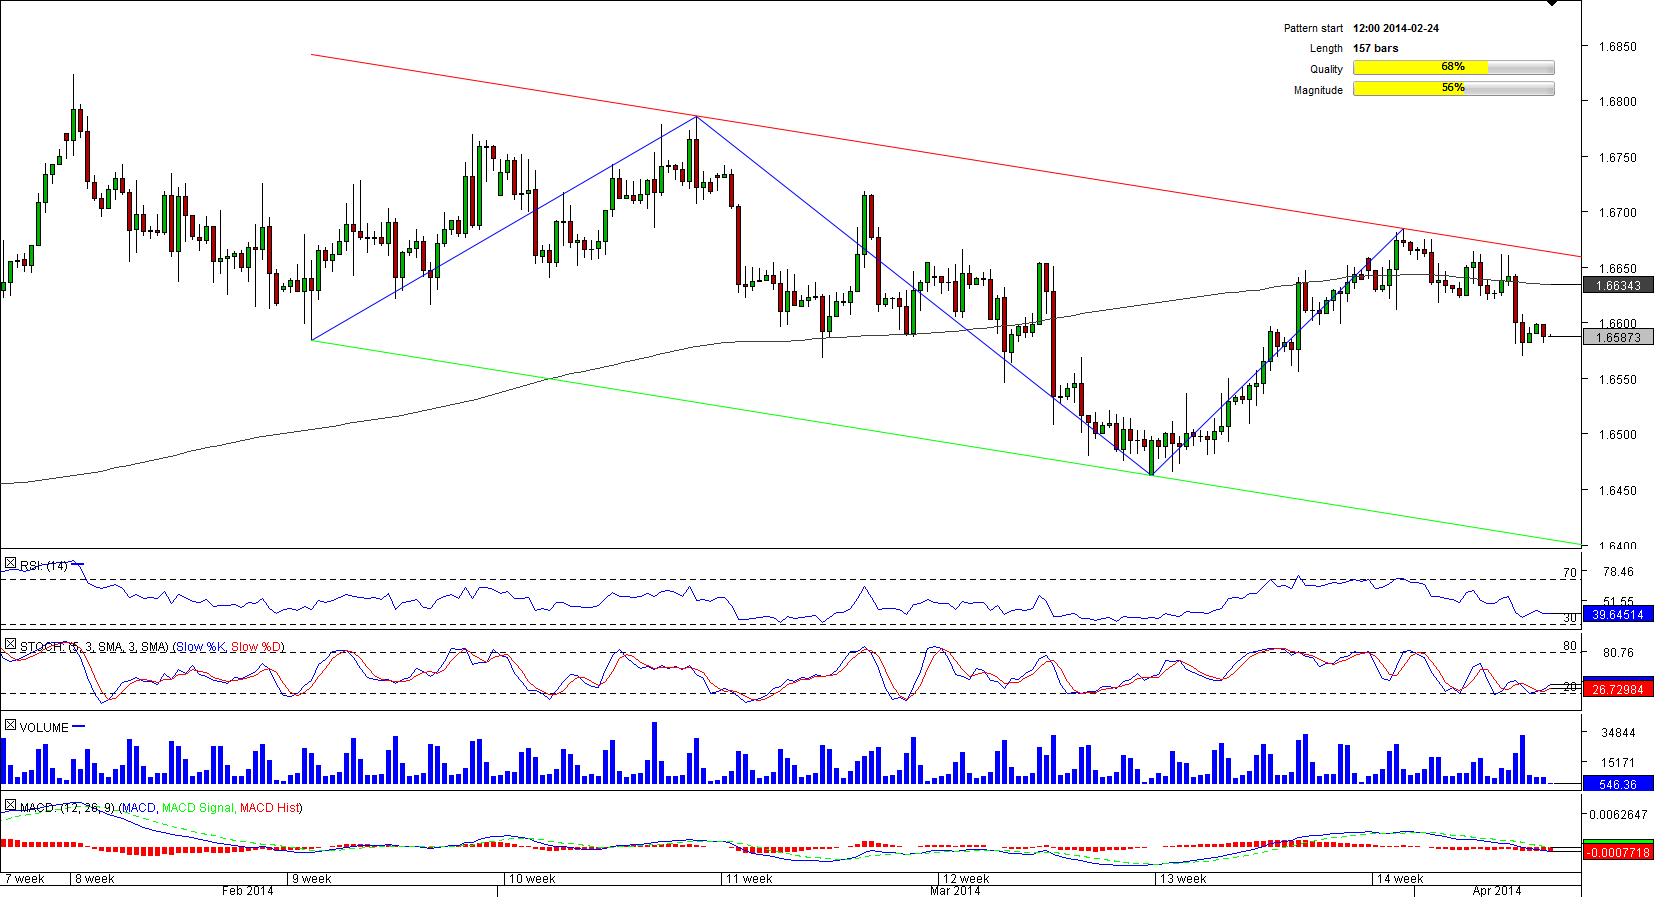
 During more than six months ended in mid-February, the British Pound was appreciating versus its U.S. counterpart and on February 17 the pair hit a five-year high of 1.6828 that became a starting point of a long-lasting decline. The drop has been mostly developing in the channel down pattern started in the very end of the winter.
Currently, GBP/USD is trading below the 50-hour SMA at 1.6608. Meanwhile, traders and technical data fail to provide any hint on the future trend of the pair. The SWFX data shows that the proportion of long to short orders is almost 1:1, while technical indicators are sending mixed signals.

Fri, 04 Apr 2014 07:22:52 GMT
Source: Dukascopy Bank SA
© Dukascopy Bank SA
Currently, GBP/USD is trading below the 50-hour SMA at 1.6608. Meanwhile, traders and technical data fail to provide any hint on the future trend of the pair. The SWFX data shows that the proportion of long to short orders is almost 1:1, while technical indicators are sending mixed signals.
© Dukascopy Bank SA
Actual Topics
Subscribe to "Fundamental Analysis" feed
订阅
欲了解更多有关杜高斯贝银行差价合约/外汇交易平台,SWFX和其它相关交易详情,
请致电我们或要求回电。
请致电我们或要求回电。
For further information regarding potential cooperation,
please call us or make callback request.
please call us or make callback request.
To learn more about Dukascopy Bank Binary Options
/ Forex trading platform, SWFX and other trading related information,
please call us or make callback request.
please call us or make callback request.
欲了解更多有关杜高斯贝银行差价合约/外汇交易平台,SWFX和其它相关交易详情,
请致电我们或要求回电。
请致电我们或要求回电。
To learn more about Crypto Trading / CFD / Forex trading platform, SWFX and other trading related information,
please call us or make callback request.
please call us or make callback request.
To learn more about Business Introducer and other trading related information,
please call us or make callback request.
please call us or make callback request.
For further information regarding potential cooperation,
please call us or make callback request.
please call us or make callback request.