The pair has recently surpassed the 50-hour SMA at 1.9805 and now is approaching the neck-line at 1.9877, suggesting that the breakout is looming. However, to reach this formidable resistance, the pair has to overcome some hindrances, namely the four-hour R1, R2 and daily R1 lying at the level 1.9843/63. Technical indicators signalize the pair may try to jump above this resistances, pointing to a strength in the short and long terms.
Note: This section contains information in English only.
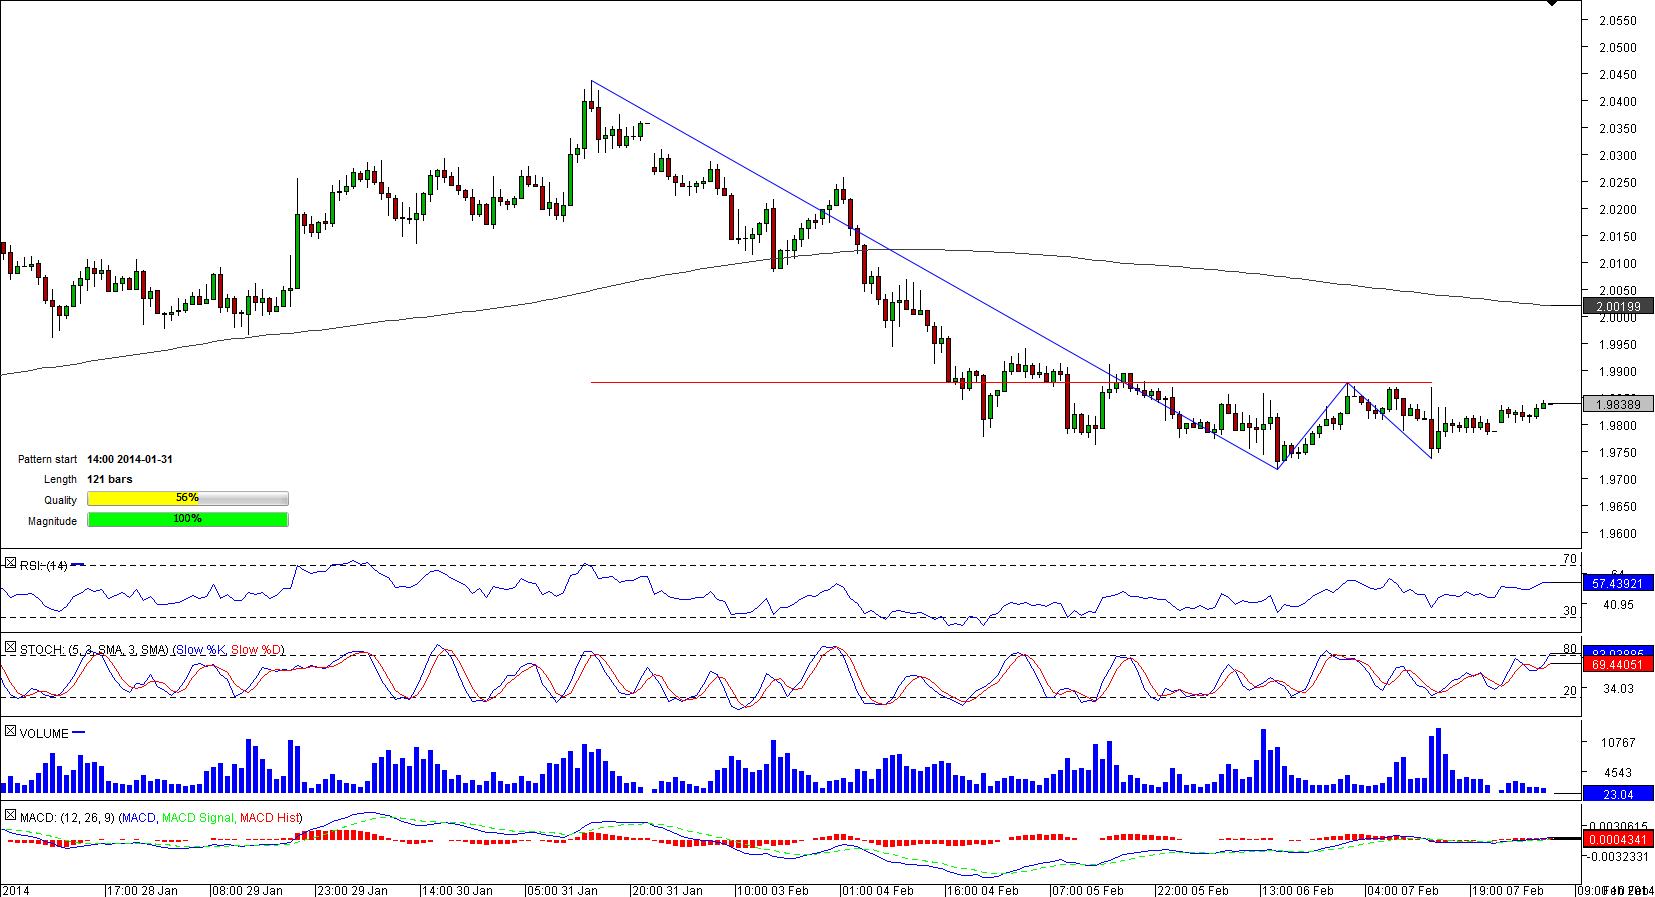
 A rise to a two-year high of 2.0436 in the very end of January initiated an accelerating depreciation of the British Pound versus the New Zealand Dollar that was a part of the double bottom pattern.
The pair has recently surpassed the 50-hour SMA at 1.9805 and now is approaching the neck-line at 1.9877, suggesting that the breakout is looming. However, to reach this formidable resistance, the pair has to overcome some hindrances, namely the four-hour R1, R2 and daily R1 lying at the level 1.9843/63. Technical indicators signalize the pair may try to jump above this resistances, pointing to a strength in the short and long terms.

Mon, 10 Feb 2014 07:51:25 GMT
Source: Dukascopy Bank SA
© Dukascopy Bank SA
The pair has recently surpassed the 50-hour SMA at 1.9805 and now is approaching the neck-line at 1.9877, suggesting that the breakout is looming. However, to reach this formidable resistance, the pair has to overcome some hindrances, namely the four-hour R1, R2 and daily R1 lying at the level 1.9843/63. Technical indicators signalize the pair may try to jump above this resistances, pointing to a strength in the short and long terms.
© Dukascopy Bank SA
Actual Topics
Subscribe to "Fundamental Analysis" feed
订阅
欲了解更多有关杜高斯贝银行差价合约/外汇交易平台,SWFX和其它相关交易详情,
请致电我们或要求回电。
请致电我们或要求回电。
For further information regarding potential cooperation,
please call us or make callback request.
please call us or make callback request.
To learn more about Dukascopy Bank Binary Options
/ Forex trading platform, SWFX and other trading related information,
please call us or make callback request.
please call us or make callback request.
欲了解更多有关杜高斯贝银行差价合约/外汇交易平台,SWFX和其它相关交易详情,
请致电我们或要求回电。
请致电我们或要求回电。
To learn more about Crypto Trading / CFD / Forex trading platform, SWFX and other trading related information,
please call us or make callback request.
please call us or make callback request.
To learn more about Business Introducer and other trading related information,
please call us or make callback request.
please call us or make callback request.
For further information regarding potential cooperation,
please call us or make callback request.
please call us or make callback request.