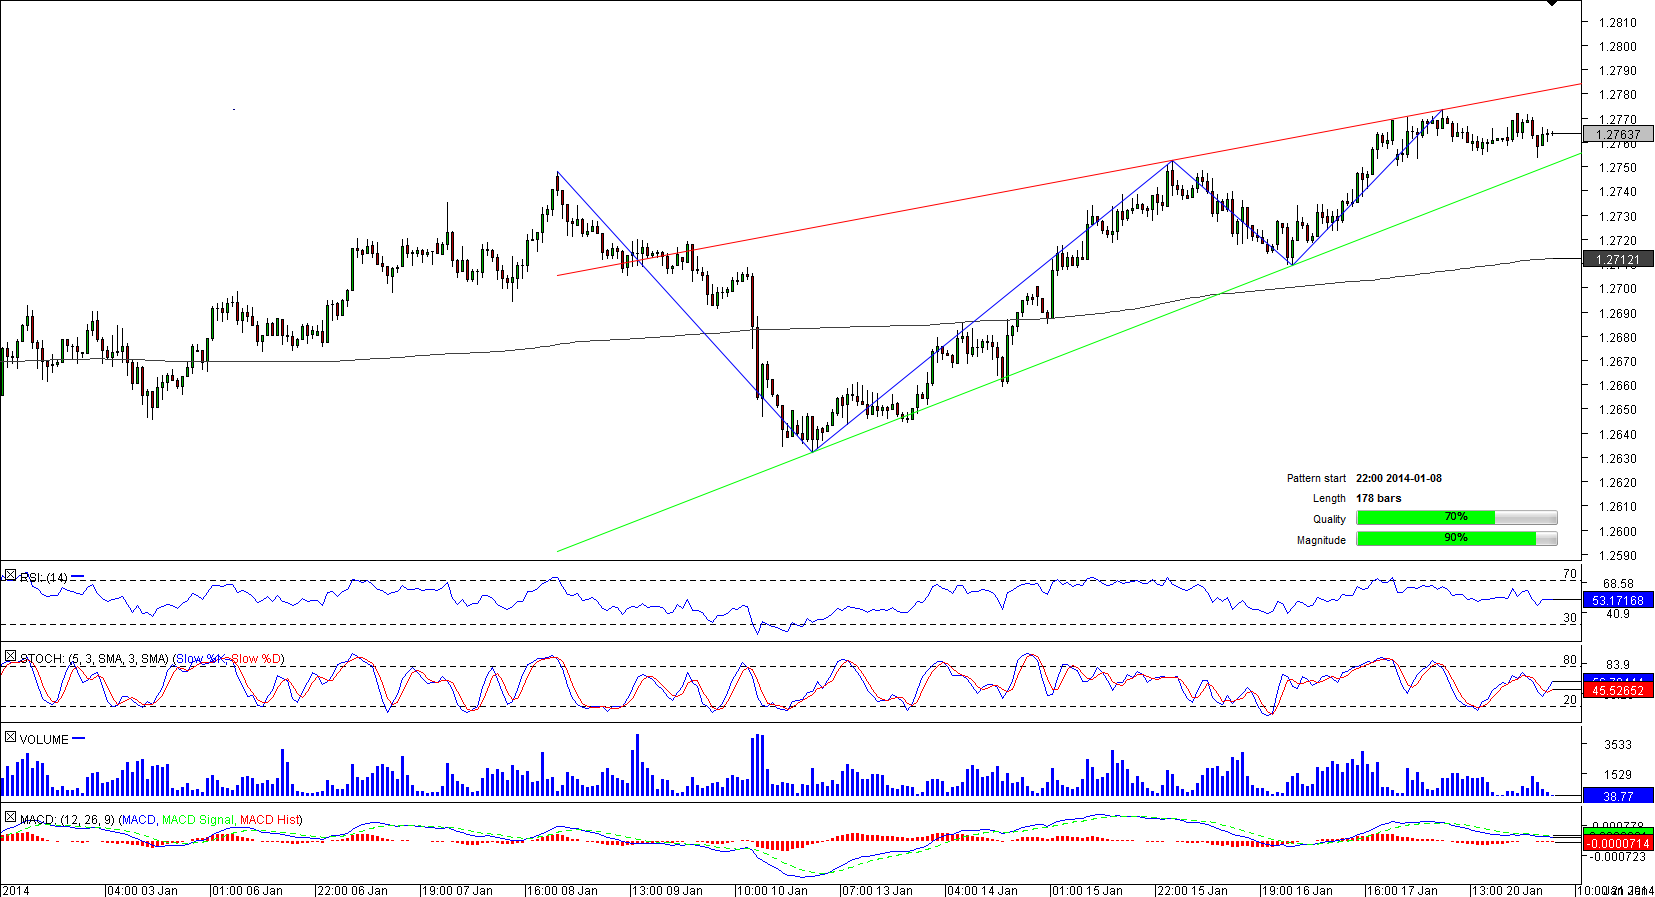
Currently, the currency couple is trading between its six-month high of 1.2773 and the 50-hour SMA at 1.2755. Although the 31-pips wide trading range signifies that the breakout is looming, the direction of the breakout seems to be obscure. If the pair manages to surpass its six-month high, the rally may lie ahead, on the contrary, if the pair breaches the 50-hour SMA, USD/SGD may witness a sharp decline.
Note: This section contains information in English only.
 Positive fundaments have been pushing the U.S. Dollar higher against most of its counterparts for several weeks hence it comes as no surprise that the pair's moves led to a formation of the bullish pattern-rising wedge.
Currently, the currency couple is trading between its six-month high of 1.2773 and the 50-hour SMA at 1.2755. Although the 31-pips wide trading range signifies that the breakout is looming, the direction of the breakout seems to be obscure. If the pair manages to surpass its six-month high, the rally may lie ahead, on the contrary, if the pair breaches the 50-hour SMA, USD/SGD may witness a sharp decline.

Tue, 21 Jan 2014 07:11:05 GMT
Source: Dukascopy Bank SA
© Dukascopy Bank SA
Currently, the currency couple is trading between its six-month high of 1.2773 and the 50-hour SMA at 1.2755. Although the 31-pips wide trading range signifies that the breakout is looming, the direction of the breakout seems to be obscure. If the pair manages to surpass its six-month high, the rally may lie ahead, on the contrary, if the pair breaches the 50-hour SMA, USD/SGD may witness a sharp decline.
© Dukascopy Bank SA
Actual Topics
Subscribe to "Fundamental Analysis" feed
订阅
欲了解更多有关杜高斯贝银行差价合约/外汇交易平台,SWFX和其它相关交易详情,
请致电我们或要求回电。
请致电我们或要求回电。
For further information regarding potential cooperation,
please call us or make callback request.
please call us or make callback request.
To learn more about Dukascopy Bank Binary Options
/ Forex trading platform, SWFX and other trading related information,
please call us or make callback request.
please call us or make callback request.
欲了解更多有关杜高斯贝银行差价合约/外汇交易平台,SWFX和其它相关交易详情,
请致电我们或要求回电。
请致电我们或要求回电。
To learn more about Crypto Trading / CFD / Forex trading platform, SWFX and other trading related information,
please call us or make callback request.
please call us or make callback request.
To learn more about Business Introducer and other trading related information,
please call us or make callback request.
please call us or make callback request.
For further information regarding potential cooperation,
please call us or make callback request.
please call us or make callback request.