Note: This section contains information in English only.


Mon, 02 Dec 2013 15:18:15 GMT
Source: Dukascopy Bank SA
© Dukascopy Bank SA
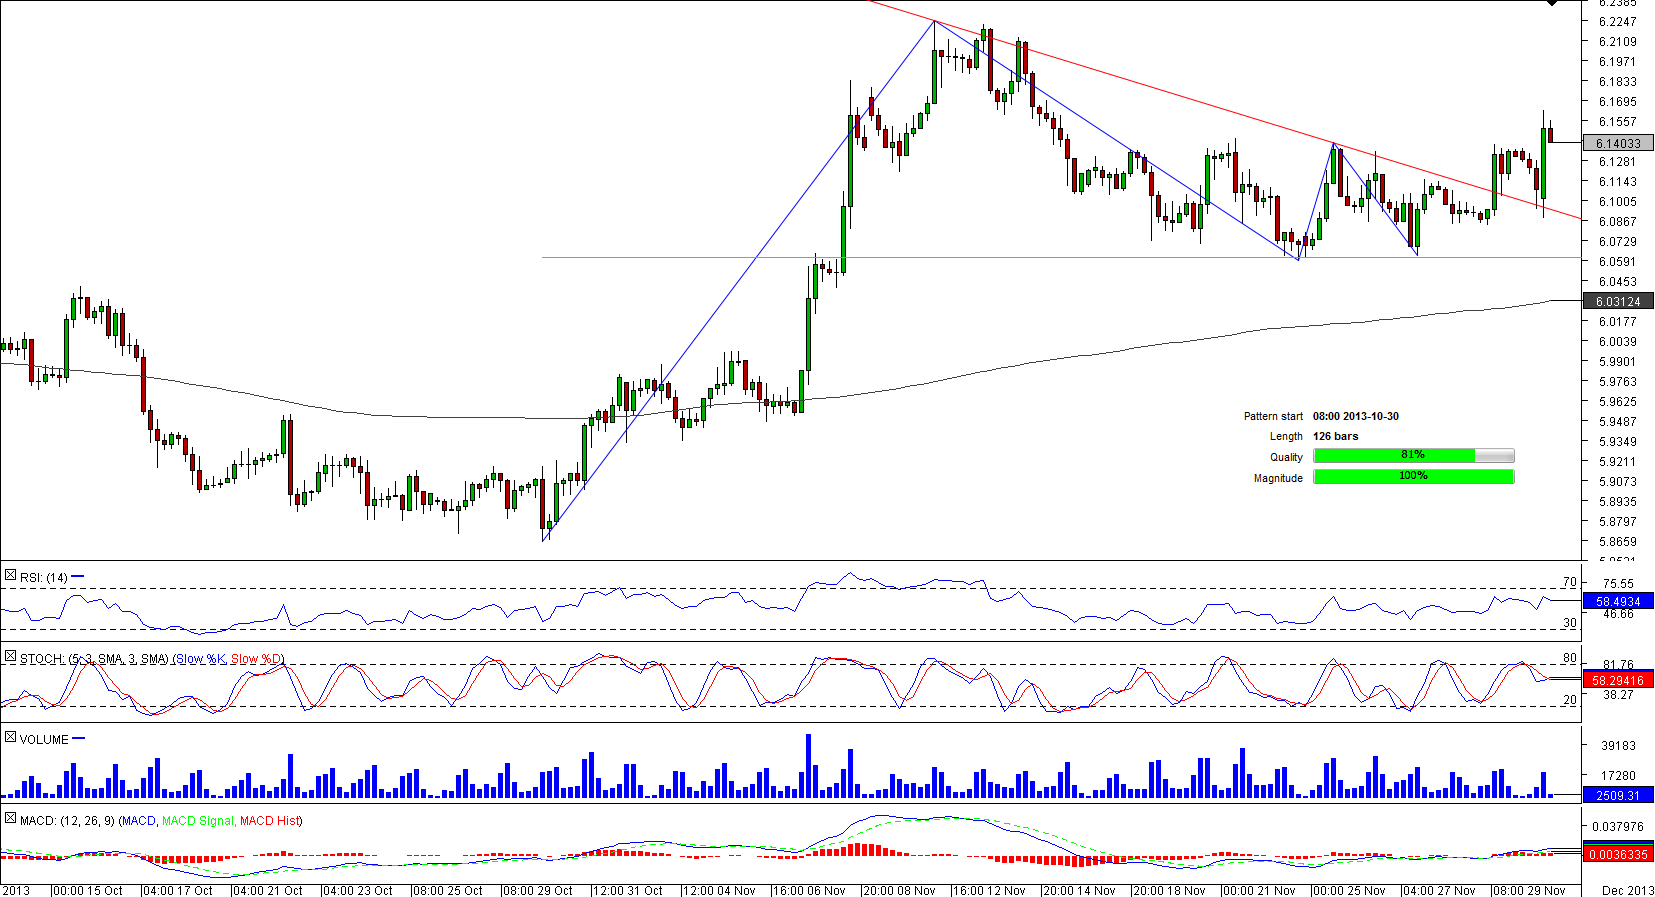
USD/NOK started to post lower peaks but at the same time bounce off the support at 6.0632 in early November after a failure to breach the resistance at 6.2250. In the end this behaviour turned out into appearance of the descending triangle.
On Nov 29 the currency pair violated the down-trend resistance line and reached the first target at 6.1366. Subsequently, after a brief pull-back, USD/NOK has found a strong support level at 6.0810, which is likely to initiate a recovery that might extend up to 6.2250. For the time being the four-hour and weekly technical indicators are in favour of a bullish scenario.
© Dukascopy Bank SA
Actual Topics
Subscribe to "Fundamental Analysis" feed
订阅
欲了解更多有关杜高斯贝银行差价合约/外汇交易平台,SWFX和其它相关交易详情,
请致电我们或要求回电。
请致电我们或要求回电。
For further information regarding potential cooperation,
please call us or make callback request.
please call us or make callback request.
To learn more about Dukascopy Bank Binary Options
/ Forex trading platform, SWFX and other trading related information,
please call us or make callback request.
please call us or make callback request.
欲了解更多有关杜高斯贝银行差价合约/外汇交易平台,SWFX和其它相关交易详情,
请致电我们或要求回电。
请致电我们或要求回电。
To learn more about Crypto Trading / CFD / Forex trading platform, SWFX and other trading related information,
please call us or make callback request.
please call us or make callback request.
To learn more about Business Introducer and other trading related information,
please call us or make callback request.
please call us or make callback request.
For further information regarding potential cooperation,
please call us or make callback request.
please call us or make callback request.