Note: This section contains information in English only.


Wed, 25 Sep 2013 07:27:13 GMT
Source: Dukascopy Bank SA
© Dukascopy Bank SA
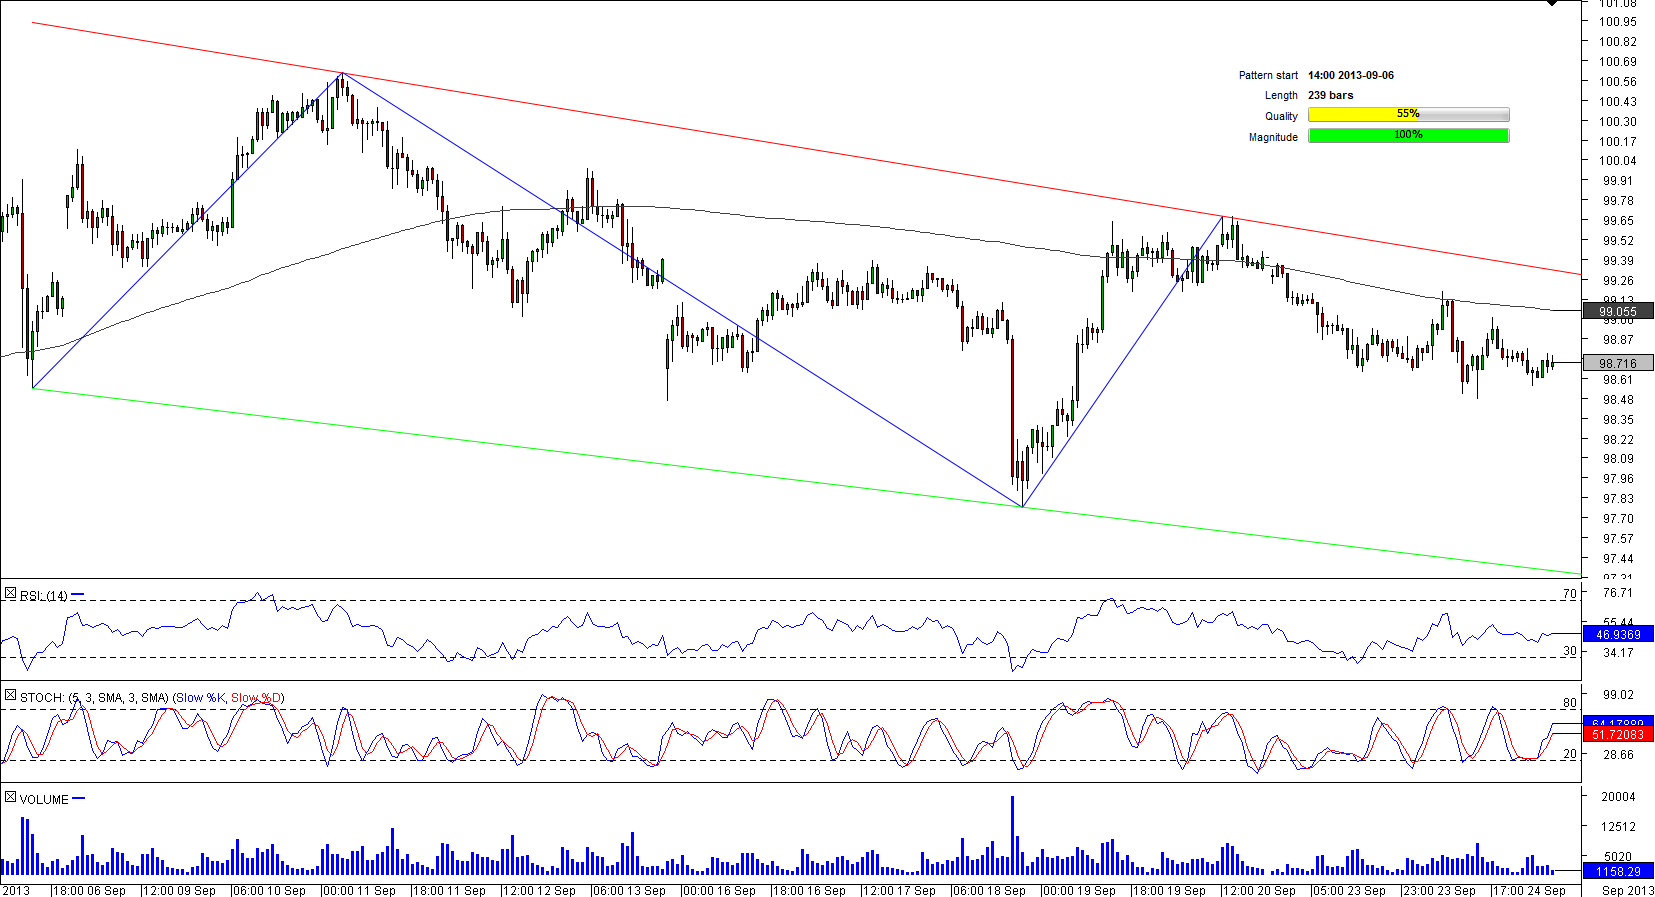
If we connect the most prominent valleys and peaks of USD/JPY hourly chart that have appeared since Sep 6 with straight lines, we would get a bearish channel. And even though the parallel trend-lines that are supposedly guiding the currency pair lower have not yet been confirmed on many occasions, there is a good chance this corridor will prove to be important in the future.
Meanwhile, the bias towards USD/JPY is strongly bearish. Apart from the numerous ‘sell' signals on hourly, four-hour and daily charts, the price fluctuates beneath the 200-hour SMA, a fact that means existence of additional downward pressure on the U.S. Dollar relative to the Yen.
© Dukascopy Bank SA
Actual Topics
Subscribe to "Fundamental Analysis" feed
订阅
欲了解更多有关杜高斯贝银行差价合约/外汇交易平台,SWFX和其它相关交易详情,
请致电我们或要求回电。
请致电我们或要求回电。
For further information regarding potential cooperation,
please call us or make callback request.
please call us or make callback request.
To learn more about Dukascopy Bank Binary Options
/ Forex trading platform, SWFX and other trading related information,
please call us or make callback request.
please call us or make callback request.
欲了解更多有关杜高斯贝银行差价合约/外汇交易平台,SWFX和其它相关交易详情,
请致电我们或要求回电。
请致电我们或要求回电。
To learn more about Crypto Trading / CFD / Forex trading platform, SWFX and other trading related information,
please call us or make callback request.
please call us or make callback request.
To learn more about Business Introducer and other trading related information,
please call us or make callback request.
please call us or make callback request.
For further information regarding potential cooperation,
please call us or make callback request.
please call us or make callback request.