Note: This section contains information in English only.
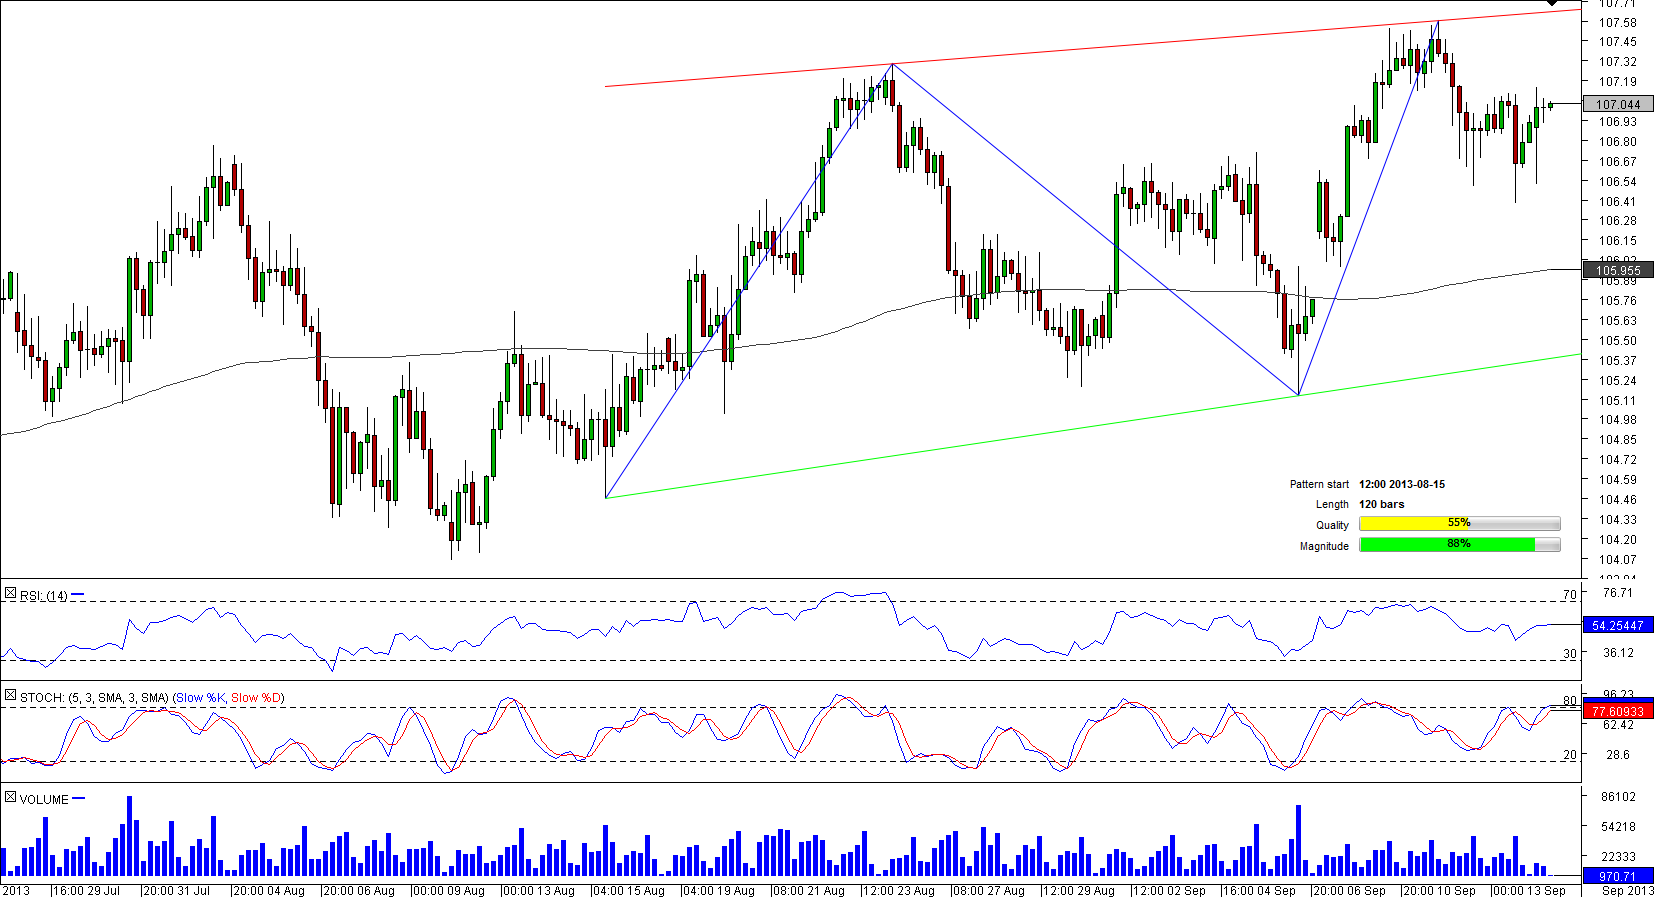
 CHF/JPY has been gradually appreciating since August 15, when the pair started to shape a channel up pattern. On September 11, the currency couple hit a five-month high of 107.59 that alleviated a buying pressure and forced the pair to descend to the four-hour pivot point at 107.00. Market players are strongly bullish on the pair, with 85.71% of all orders are placed to buy CHF/JPY. If traders' outlook materializes, the pair will break two important resistance lines lying at 107.09/10 to attain the daily resistance at 107.21. The pair may try to overcome this formidable region to prolong its rally towards the next pitfall at 107.51 (daily R2).

Mon, 16 Sep 2013 07:00:49 GMT
Source: Dukascopy Bank SA
© Dukascopy Bank SA
© Dukascopy Bank SA
Actual Topics
Subscribe to "Fundamental Analysis" feed
订阅
欲了解更多有关杜高斯贝银行差价合约/外汇交易平台,SWFX和其它相关交易详情,
请致电我们或要求回电。
请致电我们或要求回电。
For further information regarding potential cooperation,
please call us or make callback request.
please call us or make callback request.
To learn more about Dukascopy Bank Binary Options
/ Forex trading platform, SWFX and other trading related information,
please call us or make callback request.
please call us or make callback request.
欲了解更多有关杜高斯贝银行差价合约/外汇交易平台,SWFX和其它相关交易详情,
请致电我们或要求回电。
请致电我们或要求回电。
To learn more about Crypto Trading / CFD / Forex trading platform, SWFX and other trading related information,
please call us or make callback request.
please call us or make callback request.
To learn more about Business Introducer and other trading related information,
please call us or make callback request.
please call us or make callback request.
For further information regarding potential cooperation,
please call us or make callback request.
please call us or make callback request.