Note: This section contains information in English only.
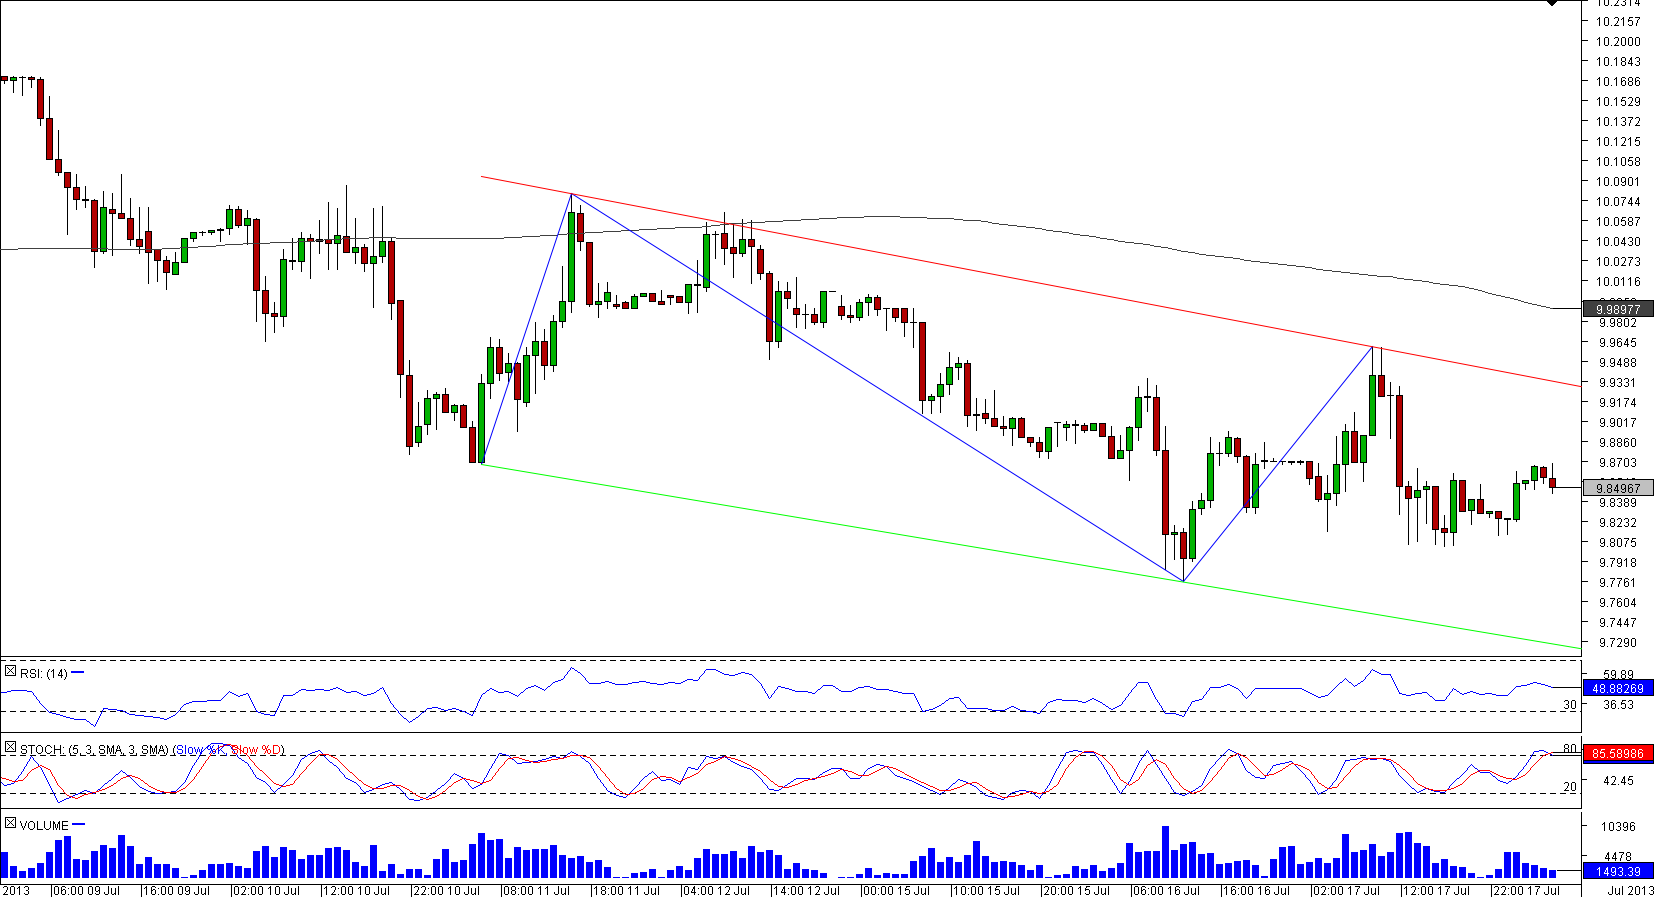
 USD/ZAR has recently breached the 200-hour SMA, an event that marked the start of the channel down formation. The pattern is already 100 bars long, during which the boundaries of the corridor were tested on several occasions.

Thu, 18 Jul 2013 07:25:03 GMT
Source: Dukascopy Bank SA
© Dukascopy Bank SA
Considering this set-up, the outlook on the currency pair is negative, even though technical indicators are only slightly bearish. SWFX marketplace participants, however, are strongly convinced that the U.S. Dollar is going to weaken, being that an overwhelming majority (70%) of open positions are short at the moment.
© Dukascopy Bank SA
Actual Topics
Subscribe to "Fundamental Analysis" feed
订阅
欲了解更多有关杜高斯贝银行差价合约/外汇交易平台,SWFX和其它相关交易详情,
请致电我们或要求回电。
请致电我们或要求回电。
For further information regarding potential cooperation,
please call us or make callback request.
please call us or make callback request.
To learn more about Dukascopy Bank Binary Options
/ Forex trading platform, SWFX and other trading related information,
please call us or make callback request.
please call us or make callback request.
欲了解更多有关杜高斯贝银行差价合约/外汇交易平台,SWFX和其它相关交易详情,
请致电我们或要求回电。
请致电我们或要求回电。
To learn more about Crypto Trading / CFD / Forex trading platform, SWFX and other trading related information,
please call us or make callback request.
please call us or make callback request.
To learn more about Business Introducer and other trading related information,
please call us or make callback request.
please call us or make callback request.
For further information regarding potential cooperation,
please call us or make callback request.
please call us or make callback request.