According to aggregate technical indicators the pair is likely to move to the south, as indicators on 4H and 1W charts are sending "sell" signals. However, indicators on a 1D chart are pointing at appreciation of the pair, so a penetration of the resistance line should be kept in mind.
Note: This section contains information in English only.
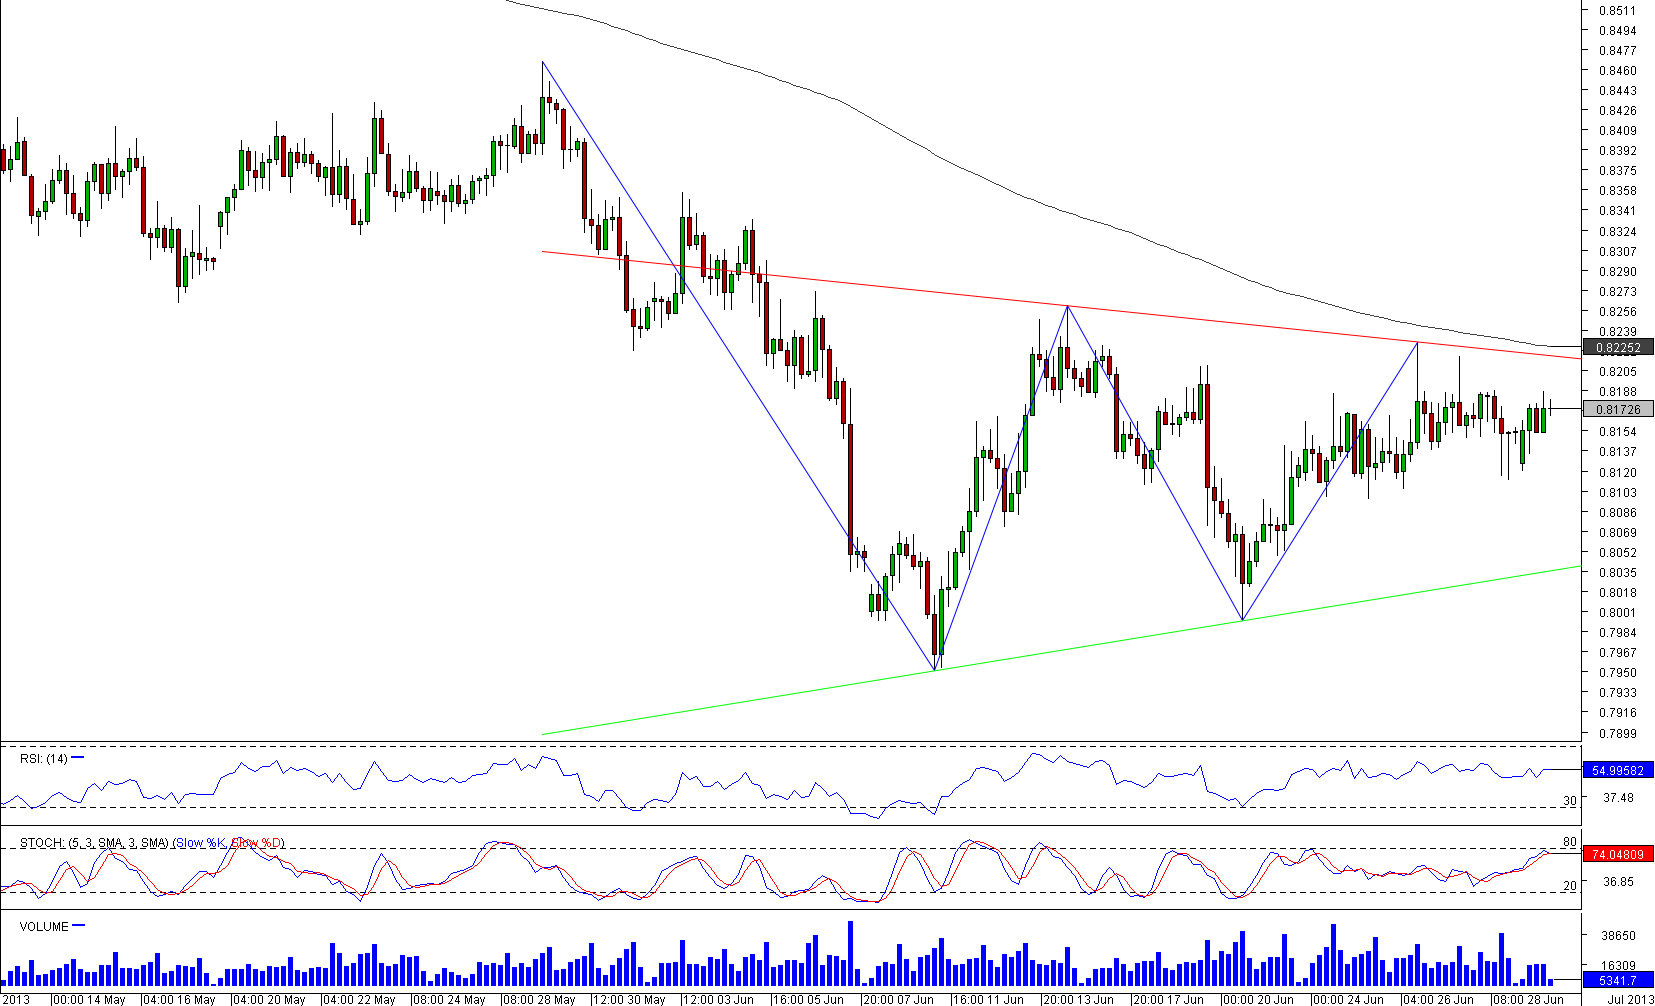
 A Triangle pattern was formed by NZD/CAD on the May 29, when the pair dropped from 0.8465, currently represented by a Fibonacci Retracement. The pattern can be very profitable for trade, as the trading range is narrowing and is now only 180 pips. Therefore, a breakout is expected, but not later then July 26, when both trend lines will converge.
According to aggregate technical indicators the pair is likely to move to the south, as indicators on 4H and 1W charts are sending "sell" signals. However, indicators on a 1D chart are pointing at appreciation of the pair, so a penetration of the resistance line should be kept in mind.

Mon, 01 Jul 2013 14:39:20 GMT
Source: Dukascopy Bank SA
© Dukascopy Bank SA
According to aggregate technical indicators the pair is likely to move to the south, as indicators on 4H and 1W charts are sending "sell" signals. However, indicators on a 1D chart are pointing at appreciation of the pair, so a penetration of the resistance line should be kept in mind.
© Dukascopy Bank SA
Actual Topics
Subscribe to "Fundamental Analysis" feed
订阅
欲了解更多有关杜高斯贝银行差价合约/外汇交易平台,SWFX和其它相关交易详情,
请致电我们或要求回电。
请致电我们或要求回电。
For further information regarding potential cooperation,
please call us or make callback request.
please call us or make callback request.
To learn more about Dukascopy Bank Binary Options
/ Forex trading platform, SWFX and other trading related information,
please call us or make callback request.
please call us or make callback request.
欲了解更多有关杜高斯贝银行差价合约/外汇交易平台,SWFX和其它相关交易详情,
请致电我们或要求回电。
请致电我们或要求回电。
To learn more about Crypto Trading / CFD / Forex trading platform, SWFX and other trading related information,
please call us or make callback request.
please call us or make callback request.
To learn more about Business Introducer and other trading related information,
please call us or make callback request.
please call us or make callback request.
For further information regarding potential cooperation,
please call us or make callback request.
please call us or make callback request.