Note: This section contains information in English only.


Thu, 27 Jun 2013 08:02:12 GMT
Source: Dukascopy Bank SA
© Dukascopy Bank SA
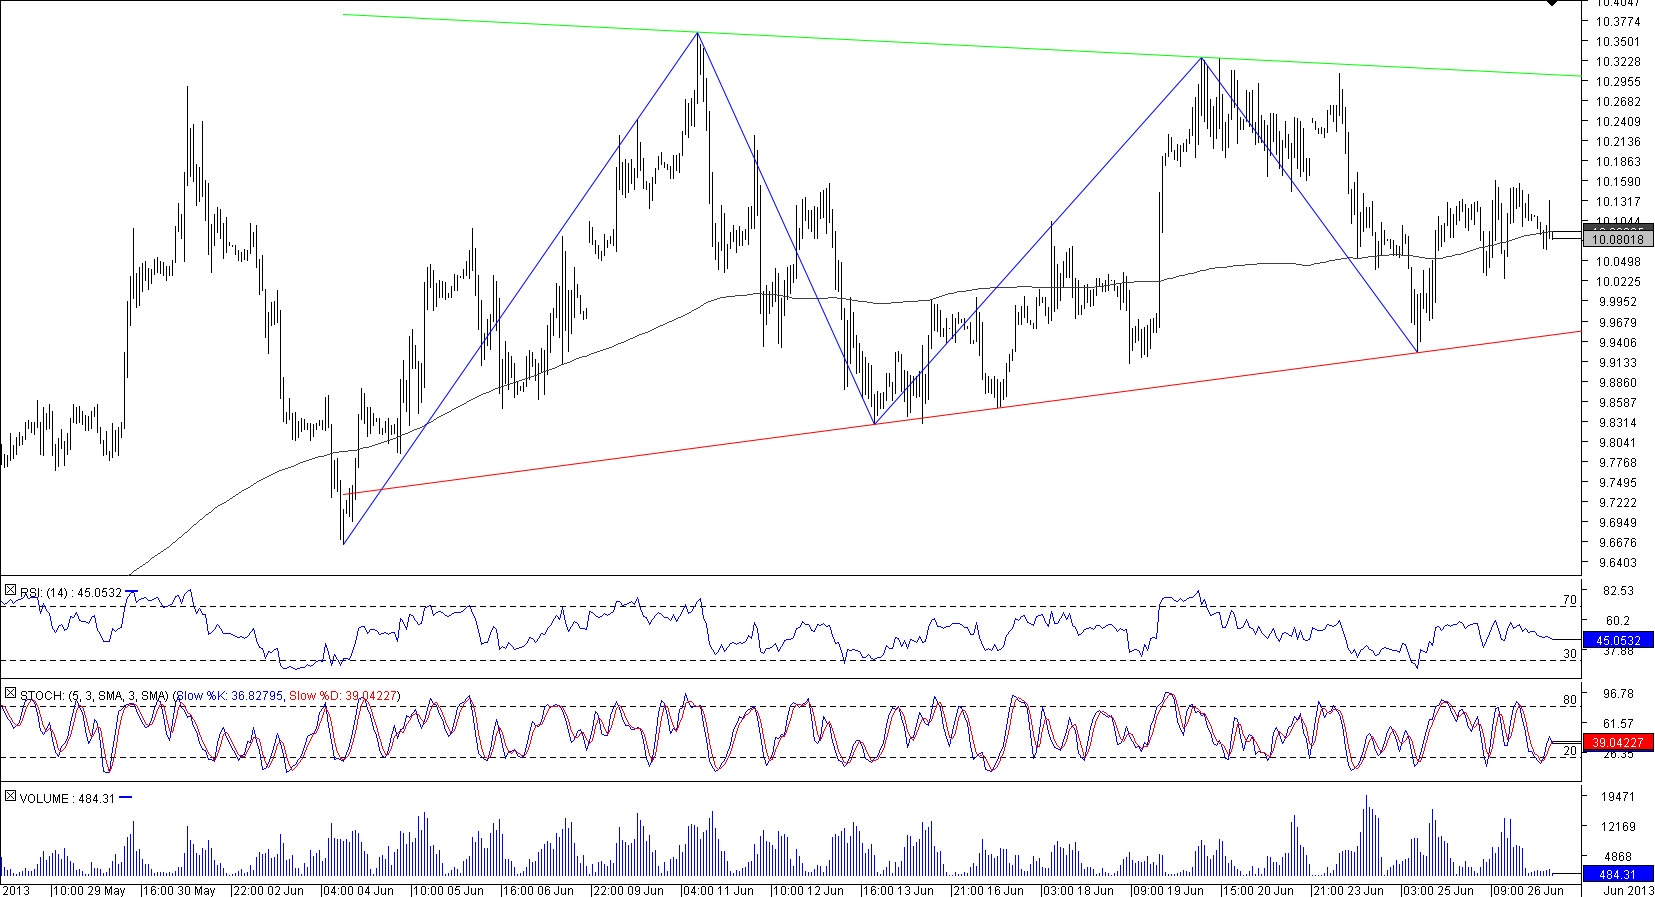
Considering that USD/ZAR lately has been posting lower peaks and higher valleys, it has formed a triangle on a 1H chart. For the time being it is unclear whether there is going to be a bullish or a bearish break-out—at the moment technical indicators stay largely silent. On the other hand, 70% of market participants believe the U.S. Dollar will underperform in the future.
In any case the 200-period SMA is to play an important role in shaping the chart. Even though it has been breached on several occasions throughout the last 350 hours, the market is consistently confirming it as the support or resistance.
© Dukascopy Bank SA
Actual Topics
Subscribe to "Fundamental Analysis" feed
订阅
欲了解更多有关杜高斯贝银行差价合约/外汇交易平台,SWFX和其它相关交易详情,
请致电我们或要求回电。
请致电我们或要求回电。
For further information regarding potential cooperation,
please call us or make callback request.
please call us or make callback request.
To learn more about Dukascopy Bank Binary Options
/ Forex trading platform, SWFX and other trading related information,
please call us or make callback request.
please call us or make callback request.
欲了解更多有关杜高斯贝银行差价合约/外汇交易平台,SWFX和其它相关交易详情,
请致电我们或要求回电。
请致电我们或要求回电。
To learn more about Crypto Trading / CFD / Forex trading platform, SWFX and other trading related information,
please call us or make callback request.
please call us or make callback request.
To learn more about Business Introducer and other trading related information,
please call us or make callback request.
please call us or make callback request.
For further information regarding potential cooperation,
please call us or make callback request.
please call us or make callback request.