Note: This section contains information in English only.
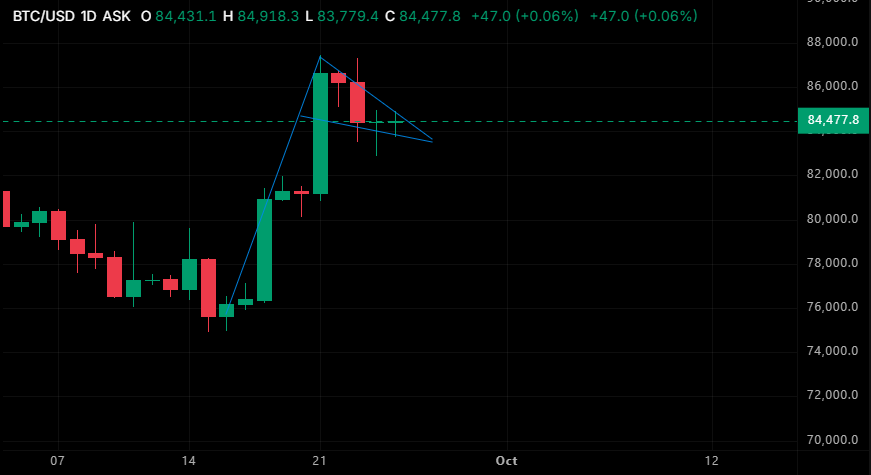
The daily BTC/USD chart displays a classic bullish pennant (or high-tight bull flag) consolidation pattern, forming after a steep, high-momentum advance (the flagpole) from the $76,000 swing lows up to near $87,000. Following that sharp impulse, price action is compressing between converging trendlines near the $84,477 level, characterized by lower highs and shallower lows as volatility contracts. In technical analysis, this structure represents a healthy pause and absorption of selling pressure, with a decisive breakout above the upper descending boundary typically signaling a continuation of the prior uptrend toward a measured move target near the $90,000–$92,000 zone.
Fri, 25 Sep 2026 08:32:34 GMT
Source: Dukascopy Bank SA
Actual Topics
欲了解更多有关杜高斯贝银行差价合约/外汇交易平台,SWFX和其它相关交易详情,
请致电我们或要求回电。
请致电我们或要求回电。
For further information regarding potential cooperation,
please call us or make callback request.
please call us or make callback request.
To learn more about Dukascopy Bank Binary Options
/ Forex trading platform, SWFX and other trading related information,
please call us or make callback request.
please call us or make callback request.
欲了解更多有关杜高斯贝银行差价合约/外汇交易平台,SWFX和其它相关交易详情,
请致电我们或要求回电。
请致电我们或要求回电。
To learn more about Crypto Trading / CFD / Forex trading platform, SWFX and other trading related information,
please call us or make callback request.
please call us or make callback request.
To learn more about Business Introducer and other trading related information,
please call us or make callback request.
please call us or make callback request.
For further information regarding potential cooperation,
please call us or make callback request.
please call us or make callback request.