Note: This section contains information in English only.
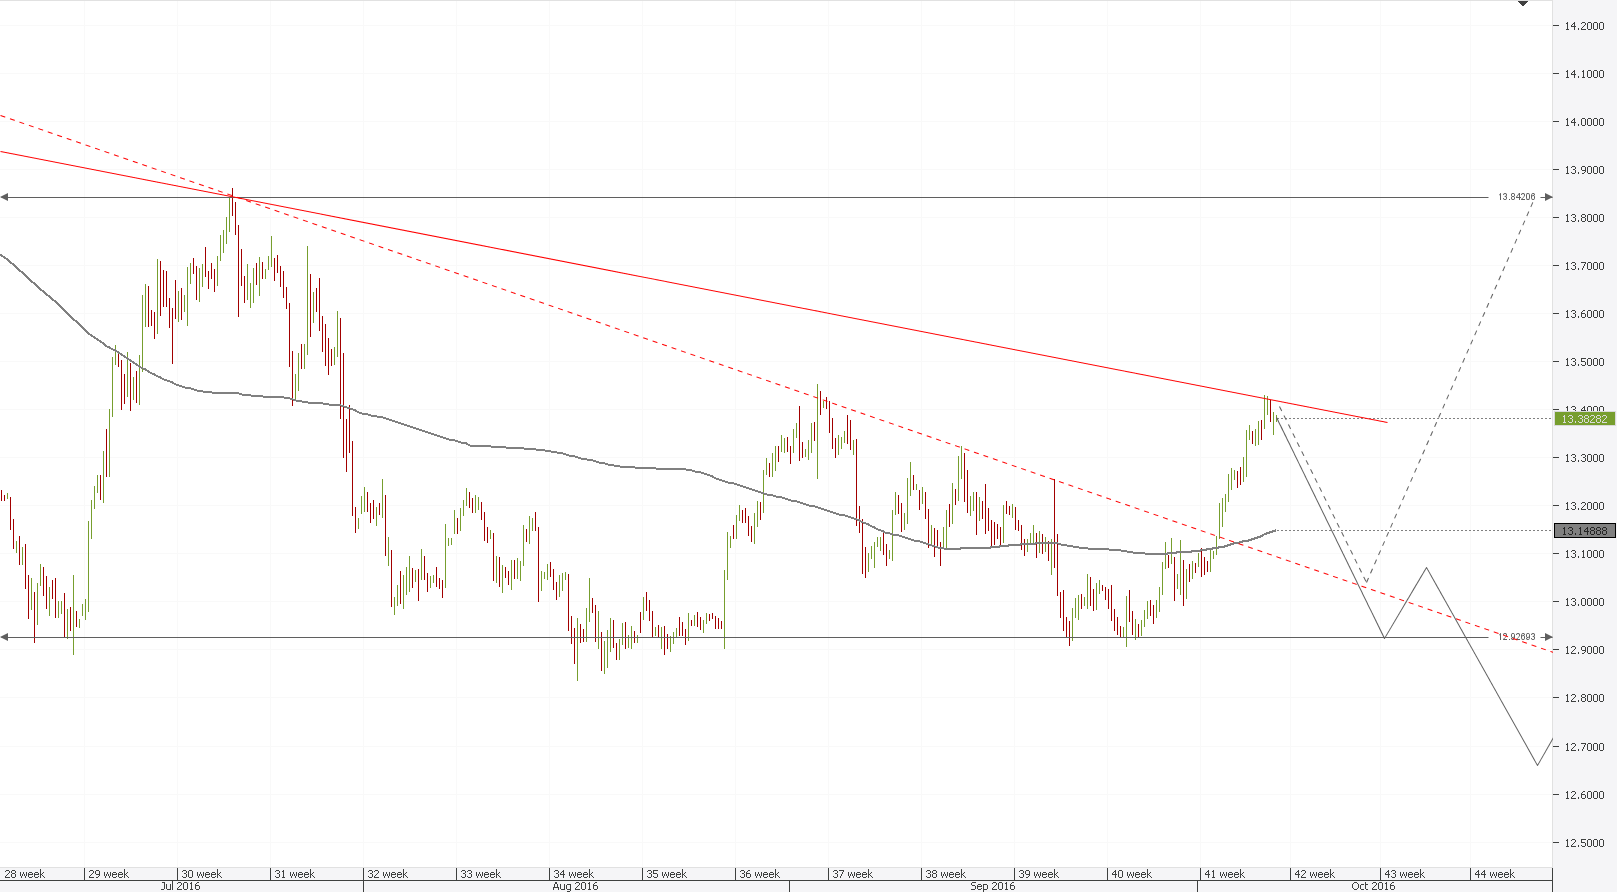
 To consolidate the downward motion, HKD/JPY entered a descending channel pattern, building up some bearish potential for a break below the support level at 12.9269. The break, however, did not go as planned, establishing a new high at 13.4194, which has sketched another upper trend-line of the triangle. We believe that the break will come either on the current wave or following several additional confirmations of the newly formed trend-line. With several SMAs pushing from below, the pair will have to put up a fight to battle through levels of significance, especially the SMA-Pivot Point-Bollinger Band confluence at 13.1090/1645. When a successful violation of the bottom line is accomplished, HKD/JPY will test 12.8302/8190 and most likely rebound for a more sufficient dip. Another scenario consists of a rebound from the recently broken trend-line at 13.0717 and an extension of the rally towards July highs at 13.8421.

Fri, 07 Oct 2016 07:08:27 GMT
Source: Dukascopy Bank SA
© Dukascopy Bank SA
© Dukascopy Bank SA
Actual Topics
Subscribe to "Fundamental Analysis" feed
تسجيل
كي تعرف المزيد عن منصة تداول دوكاسكوبي بنك للعملات وعقود الفروقات ومعلومات أخرى متعلقة بالتداول,
يرجى الاتصال بنا أو طلب اتصال.
يرجى الاتصال بنا أو طلب اتصال.
للمزيد من المعلومات حول التعاون العملي المحتمل,
يرجى الاتصال بنا او ترك طلب لاعادة الاتصال
يرجى الاتصال بنا او ترك طلب لاعادة الاتصال
للمزيد من المعلومات حول منصة تداول الفوركس\الخيارات الثنائية, السوق السويسري للفوركس و اي معلومات اخرى تتعلق بالتداول,
يرجى الاتصال بنا أو طلب اتصال.
يرجى الاتصال بنا أو طلب اتصال.
كي تعرف المزيد عن منصة تداول دوكاسكوبي بنك للعملات وعقود الفروقات ومعلومات أخرى متعلقة بالتداول,
يرجى الاتصال بنا أو طلب اتصال.
يرجى الاتصال بنا أو طلب اتصال.
للمزيد من المعلومات حول منصة تداول العملات المشفرة\عقود الفروقات\الفوركس, السوق السويسري للفوركس و اي معلومات اخرى تتعلق بالتداول,
يرجى الاتصال بنا أو طلب اتصال.
يرجى الاتصال بنا أو طلب اتصال.
للمزيد من المعلومات عن الوسطاء المعرفين واي معلومات أخرى متعلقة بالتداول,
يرجى الاتصال بنا أو طلب اتصال.
يرجى الاتصال بنا أو طلب اتصال.
للمزيد من المعلومات حول التعاون العملي المحتمل,
يرجى الاتصال بنا او ترك طلب لاعادة الاتصال
يرجى الاتصال بنا او ترك طلب لاعادة الاتصال