Note: This section contains information in English only.
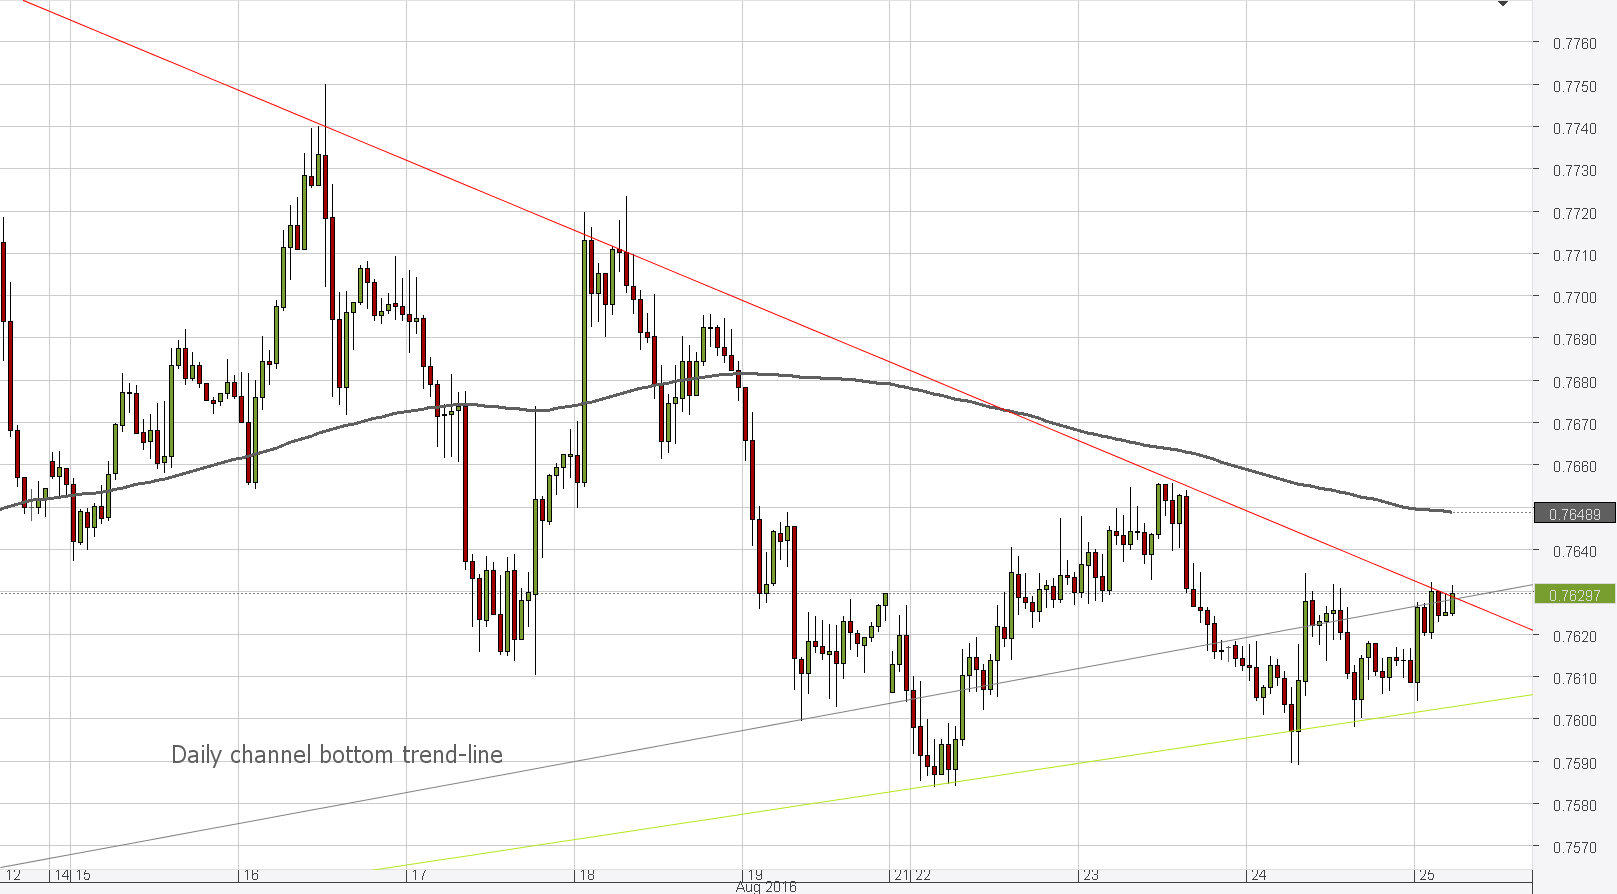
 Following the symmetrical triangle pattern, the AUD/USD currency pair can be expected to continue its way south from the 0.7628 level where it has been testing the upper trend-line. If the trend does continue, the currency will overstep the bottom trend-line at 0.7591, followed by a dip towards daily S2 at 0.7567. The crossover of the 55-hour SMA and the 100-hour SMA however gives reason to believe that a trend reversal could take place as well. In case the pair does break through the level at the top trend-line of the triangle, it will fail at the intermediate resistance of 0.7636, bounce back from the trend-line and then rally towards the 200-hour SMA, and if broken – an attempt to cross the daily R2 at 0.7658 will be made. Aggregate hourly and 4 hour technical indicators on the other hand do show potential gains from taking short positions - a forecast supported by the ascending wedge pattern formed in the daily chart since May.

Thu, 25 Aug 2016 06:51:06 GMT
Source: Dukascopy Bank SA
© Dukascopy Bank SA
© Dukascopy Bank SA
Actual Topics
Subscribe to "Fundamental Analysis" feed
تسجيل
كي تعرف المزيد عن منصة تداول دوكاسكوبي بنك للعملات وعقود الفروقات ومعلومات أخرى متعلقة بالتداول,
يرجى الاتصال بنا أو طلب اتصال.
يرجى الاتصال بنا أو طلب اتصال.
للمزيد من المعلومات حول التعاون العملي المحتمل,
يرجى الاتصال بنا او ترك طلب لاعادة الاتصال
يرجى الاتصال بنا او ترك طلب لاعادة الاتصال
للمزيد من المعلومات حول منصة تداول الفوركس\الخيارات الثنائية, السوق السويسري للفوركس و اي معلومات اخرى تتعلق بالتداول,
يرجى الاتصال بنا أو طلب اتصال.
يرجى الاتصال بنا أو طلب اتصال.
كي تعرف المزيد عن منصة تداول دوكاسكوبي بنك للعملات وعقود الفروقات ومعلومات أخرى متعلقة بالتداول,
يرجى الاتصال بنا أو طلب اتصال.
يرجى الاتصال بنا أو طلب اتصال.
للمزيد من المعلومات حول منصة تداول العملات المشفرة\عقود الفروقات\الفوركس, السوق السويسري للفوركس و اي معلومات اخرى تتعلق بالتداول,
يرجى الاتصال بنا أو طلب اتصال.
يرجى الاتصال بنا أو طلب اتصال.
للمزيد من المعلومات عن الوسطاء المعرفين واي معلومات أخرى متعلقة بالتداول,
يرجى الاتصال بنا أو طلب اتصال.
يرجى الاتصال بنا أو طلب اتصال.
للمزيد من المعلومات حول التعاون العملي المحتمل,
يرجى الاتصال بنا او ترك طلب لاعادة الاتصال
يرجى الاتصال بنا او ترك طلب لاعادة الاتصال