Note: This section contains information in English only.
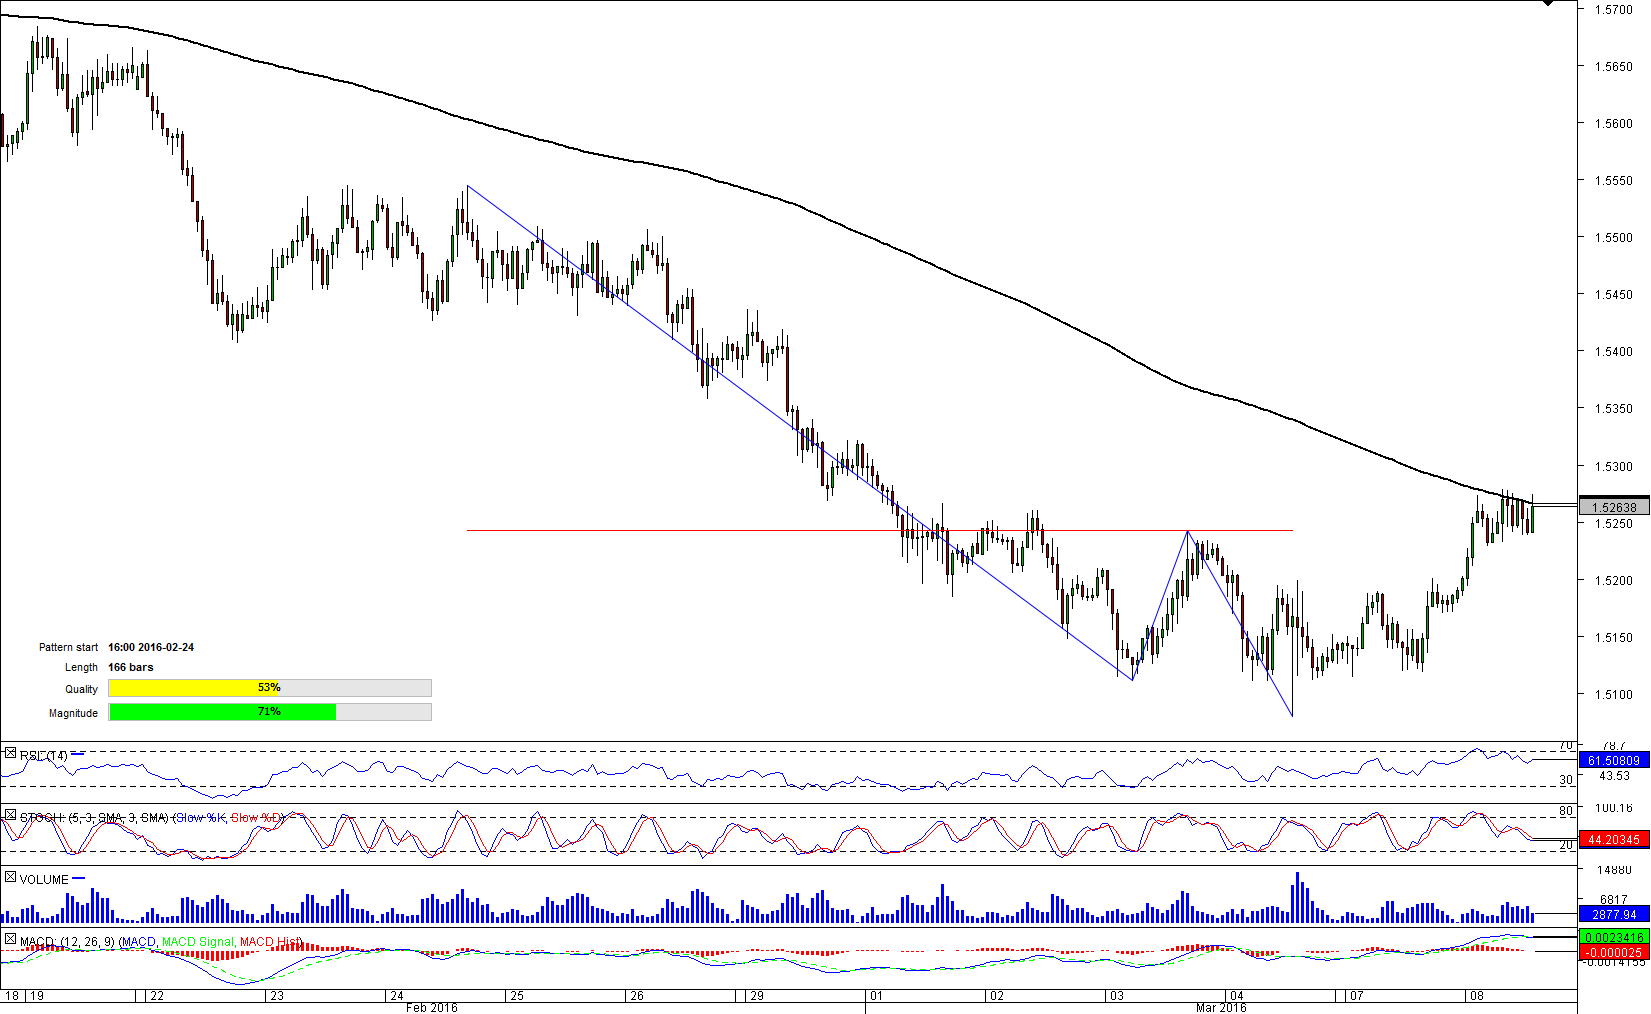
 Since double bottoms are reversal patterns, the current rebound looks completely explainable and justified. The red horizontal trend-line seems to have already been breached and now the rally is being contained by the 200-hour SMA at 1.5266. A spike above it will open the weekly R1 (1.5357) for the EUR/SGD currency pair. However, we should be careful, as the SWFX distribution between the bulls and bears (74-26%) assumes the cross remains quite overbought. Moreover, aggregate daily technical indicators are bearish, but the RSI is the only one to show a "buy" signal for the moment. Unless there is decline under the cluster of SMAs at 1.5180, our long-term outlook will remain modestly positive.

Tue, 08 Mar 2016 14:27:05 GMT
Source: Dukascopy Bank SA
© Dukascopy Bank SA
© Dukascopy Bank SA
Actual Topics
Subscribe to "Fundamental Analysis" feed
تسجيل
كي تعرف المزيد عن منصة تداول دوكاسكوبي بنك للعملات وعقود الفروقات ومعلومات أخرى متعلقة بالتداول,
يرجى الاتصال بنا أو طلب اتصال.
يرجى الاتصال بنا أو طلب اتصال.
للمزيد من المعلومات حول التعاون العملي المحتمل,
يرجى الاتصال بنا او ترك طلب لاعادة الاتصال
يرجى الاتصال بنا او ترك طلب لاعادة الاتصال
للمزيد من المعلومات حول منصة تداول الفوركس\الخيارات الثنائية, السوق السويسري للفوركس و اي معلومات اخرى تتعلق بالتداول,
يرجى الاتصال بنا أو طلب اتصال.
يرجى الاتصال بنا أو طلب اتصال.
كي تعرف المزيد عن منصة تداول دوكاسكوبي بنك للعملات وعقود الفروقات ومعلومات أخرى متعلقة بالتداول,
يرجى الاتصال بنا أو طلب اتصال.
يرجى الاتصال بنا أو طلب اتصال.
للمزيد من المعلومات حول منصة تداول العملات المشفرة\عقود الفروقات\الفوركس, السوق السويسري للفوركس و اي معلومات اخرى تتعلق بالتداول,
يرجى الاتصال بنا أو طلب اتصال.
يرجى الاتصال بنا أو طلب اتصال.
للمزيد من المعلومات عن الوسطاء المعرفين واي معلومات أخرى متعلقة بالتداول,
يرجى الاتصال بنا أو طلب اتصال.
يرجى الاتصال بنا أو طلب اتصال.
للمزيد من المعلومات حول التعاون العملي المحتمل,
يرجى الاتصال بنا او ترك طلب لاعادة الاتصال
يرجى الاتصال بنا او ترك طلب لاعادة الاتصال