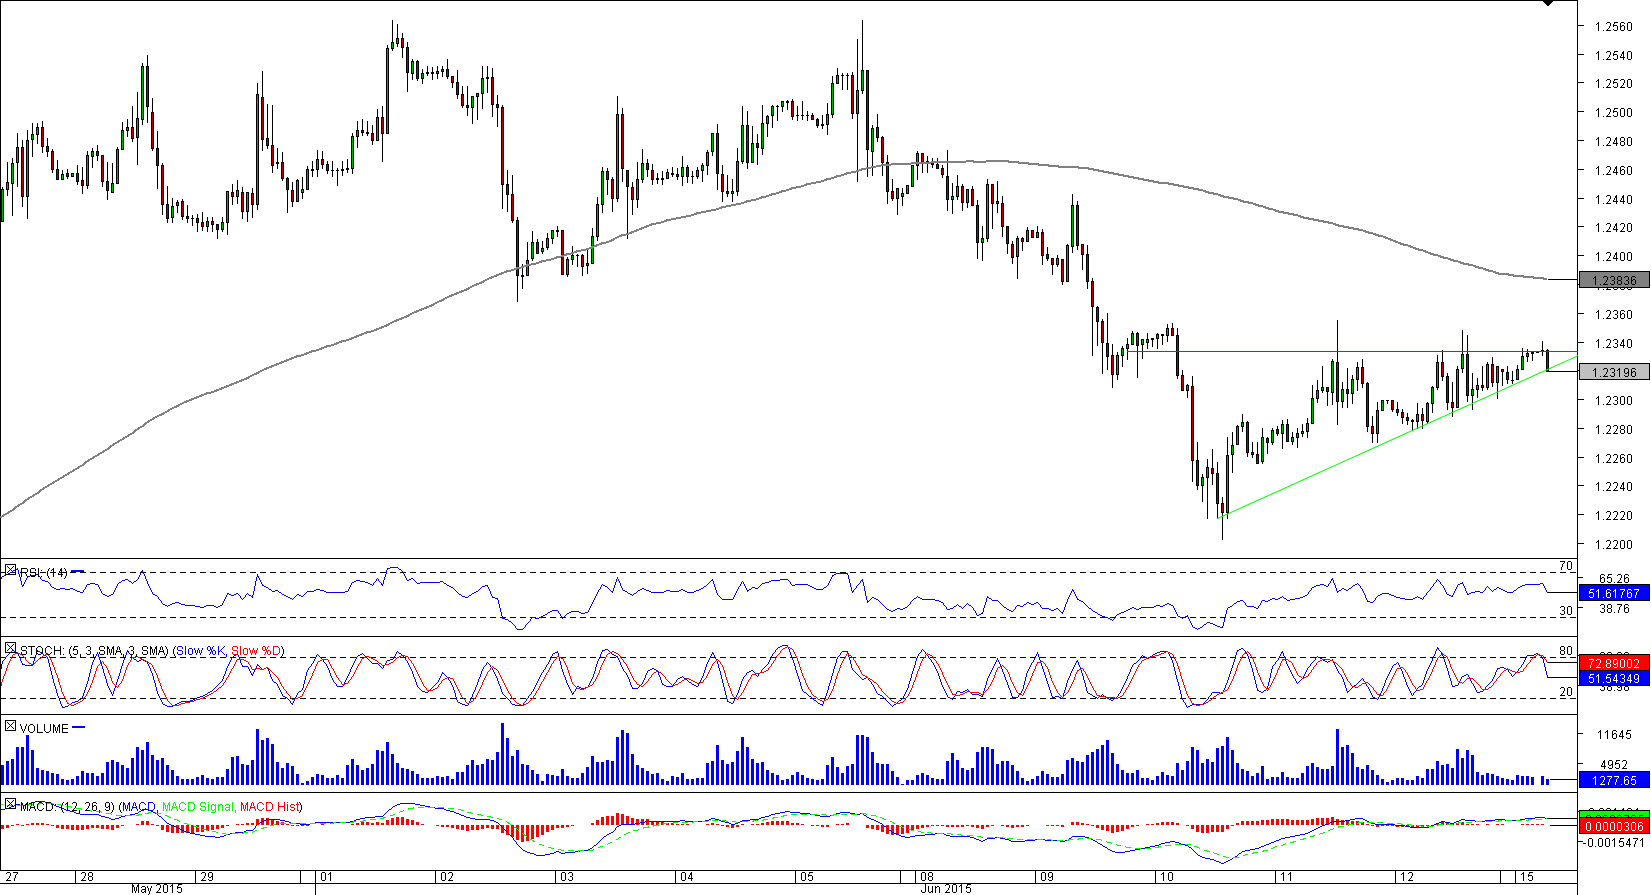
If the rate closes above 1.2333, the initial target will be the 200-hour SMA at 1.2386, where it merges with the daily R2, and there will be a real chance of a surge up to 1.2463 (weekly R1). As for the break-out to the downside, the main target will be the Jun 10 low at 1.22, but there are likely to be short-term corrections at the pivot points.
Note: This section contains information in English only.
 USD/CAD is ready to break out of the pattern. However, the signals are conflicting. The pattern itself indicates that the demand is building up. On the other hand, for a few days before the ascending triangle the market was bearish, and the price is below the long-term SMA. At the same time, the technical studies are mixed.
If the rate closes above 1.2333, the initial target will be the 200-hour SMA at 1.2386, where it merges with the daily R2, and there will be a real chance of a surge up to 1.2463 (weekly R1). As for the break-out to the downside, the main target will be the Jun 10 low at 1.22, but there are likely to be short-term corrections at the pivot points.

Mon, 15 Jun 2015 07:55:21 GMT
Source: Dukascopy Bank SA
© Dukascopy Bank SA
If the rate closes above 1.2333, the initial target will be the 200-hour SMA at 1.2386, where it merges with the daily R2, and there will be a real chance of a surge up to 1.2463 (weekly R1). As for the break-out to the downside, the main target will be the Jun 10 low at 1.22, but there are likely to be short-term corrections at the pivot points.
© Dukascopy Bank SA
Actual Topics
Subscribe to "Fundamental Analysis" feed
تسجيل
كي تعرف المزيد عن منصة تداول دوكاسكوبي بنك للعملات وعقود الفروقات ومعلومات أخرى متعلقة بالتداول,
يرجى الاتصال بنا أو طلب اتصال.
يرجى الاتصال بنا أو طلب اتصال.
للمزيد من المعلومات حول التعاون العملي المحتمل,
يرجى الاتصال بنا او ترك طلب لاعادة الاتصال
يرجى الاتصال بنا او ترك طلب لاعادة الاتصال
للمزيد من المعلومات حول منصة تداول الفوركس\الخيارات الثنائية, السوق السويسري للفوركس و اي معلومات اخرى تتعلق بالتداول,
يرجى الاتصال بنا أو طلب اتصال.
يرجى الاتصال بنا أو طلب اتصال.
كي تعرف المزيد عن منصة تداول دوكاسكوبي بنك للعملات وعقود الفروقات ومعلومات أخرى متعلقة بالتداول,
يرجى الاتصال بنا أو طلب اتصال.
يرجى الاتصال بنا أو طلب اتصال.
للمزيد من المعلومات حول منصة تداول العملات المشفرة\عقود الفروقات\الفوركس, السوق السويسري للفوركس و اي معلومات اخرى تتعلق بالتداول,
يرجى الاتصال بنا أو طلب اتصال.
يرجى الاتصال بنا أو طلب اتصال.
للمزيد من المعلومات عن الوسطاء المعرفين واي معلومات أخرى متعلقة بالتداول,
يرجى الاتصال بنا أو طلب اتصال.
يرجى الاتصال بنا أو طلب اتصال.
للمزيد من المعلومات حول التعاون العملي المحتمل,
يرجى الاتصال بنا او ترك طلب لاعادة الاتصال
يرجى الاتصال بنا او ترك طلب لاعادة الاتصال