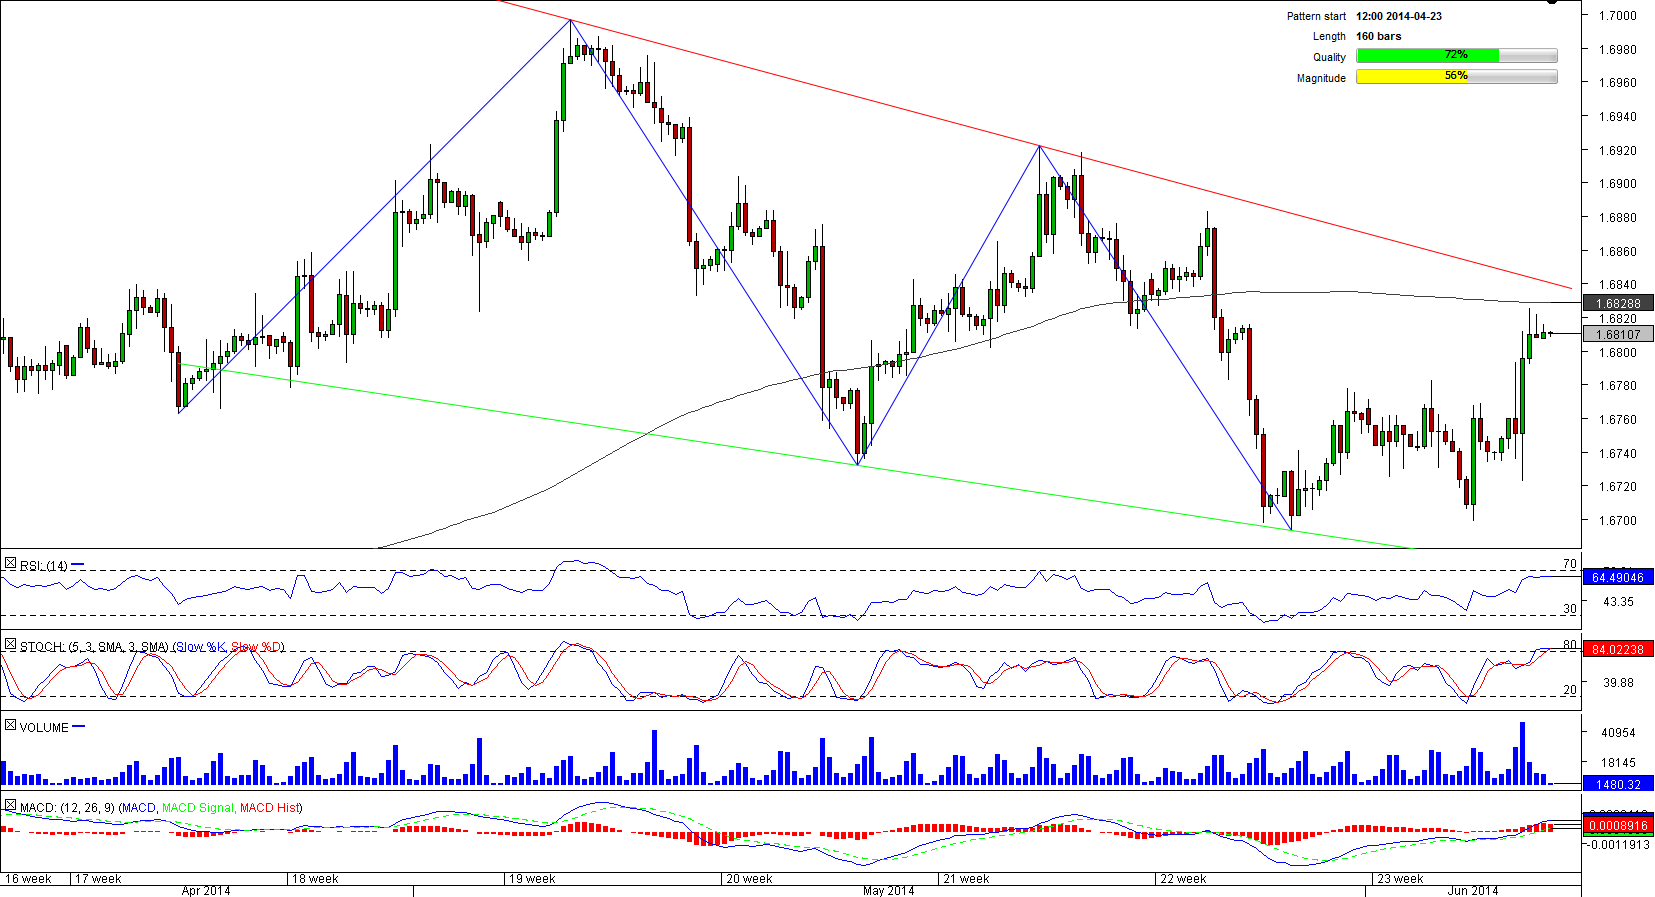
For the last six weeks, the pair has been depreciating inside the area bounded by two downward sloping gradually converging lines. Now the currency couple is headed towards the upper limit of the formation but to approach this level the pair has to overcome several hindrances, namely a cluster of four-hour resistances at 1.6815/23 and the 200-bar SMA at 1.6828, a climb above which will push the pair to the pattern's boundary, a formidable resistance that is likely to halt the advance.
Note: This section contains information in English only.
 An escalation to 1.6995, the highest level since at least 2009, seems to have exhausted GBP/USD potential and provoked a one-month long losing streak.
For the last six weeks, the pair has been depreciating inside the area bounded by two downward sloping gradually converging lines. Now the currency couple is headed towards the upper limit of the formation but to approach this level the pair has to overcome several hindrances, namely a cluster of four-hour resistances at 1.6815/23 and the 200-bar SMA at 1.6828, a climb above which will push the pair to the pattern's boundary, a formidable resistance that is likely to halt the advance.

Fri, 06 Jun 2014 06:39:59 GMT
Source: Dukascopy Bank SA
© Dukascopy Bank SA
For the last six weeks, the pair has been depreciating inside the area bounded by two downward sloping gradually converging lines. Now the currency couple is headed towards the upper limit of the formation but to approach this level the pair has to overcome several hindrances, namely a cluster of four-hour resistances at 1.6815/23 and the 200-bar SMA at 1.6828, a climb above which will push the pair to the pattern's boundary, a formidable resistance that is likely to halt the advance.
© Dukascopy Bank SA
Actual Topics
Subscribe to "Fundamental Analysis" feed
تسجيل
كي تعرف المزيد عن منصة تداول دوكاسكوبي بنك للعملات وعقود الفروقات ومعلومات أخرى متعلقة بالتداول,
يرجى الاتصال بنا أو طلب اتصال.
يرجى الاتصال بنا أو طلب اتصال.
للمزيد من المعلومات حول التعاون العملي المحتمل,
يرجى الاتصال بنا او ترك طلب لاعادة الاتصال
يرجى الاتصال بنا او ترك طلب لاعادة الاتصال
للمزيد من المعلومات حول منصة تداول الفوركس\الخيارات الثنائية, السوق السويسري للفوركس و اي معلومات اخرى تتعلق بالتداول,
يرجى الاتصال بنا أو طلب اتصال.
يرجى الاتصال بنا أو طلب اتصال.
كي تعرف المزيد عن منصة تداول دوكاسكوبي بنك للعملات وعقود الفروقات ومعلومات أخرى متعلقة بالتداول,
يرجى الاتصال بنا أو طلب اتصال.
يرجى الاتصال بنا أو طلب اتصال.
للمزيد من المعلومات حول منصة تداول العملات المشفرة\عقود الفروقات\الفوركس, السوق السويسري للفوركس و اي معلومات اخرى تتعلق بالتداول,
يرجى الاتصال بنا أو طلب اتصال.
يرجى الاتصال بنا أو طلب اتصال.
للمزيد من المعلومات عن الوسطاء المعرفين واي معلومات أخرى متعلقة بالتداول,
يرجى الاتصال بنا أو طلب اتصال.
يرجى الاتصال بنا أو طلب اتصال.
للمزيد من المعلومات حول التعاون العملي المحتمل,
يرجى الاتصال بنا او ترك طلب لاعادة الاتصال
يرجى الاتصال بنا او ترك طلب لاعادة الاتصال