Note: This section contains information in English only.
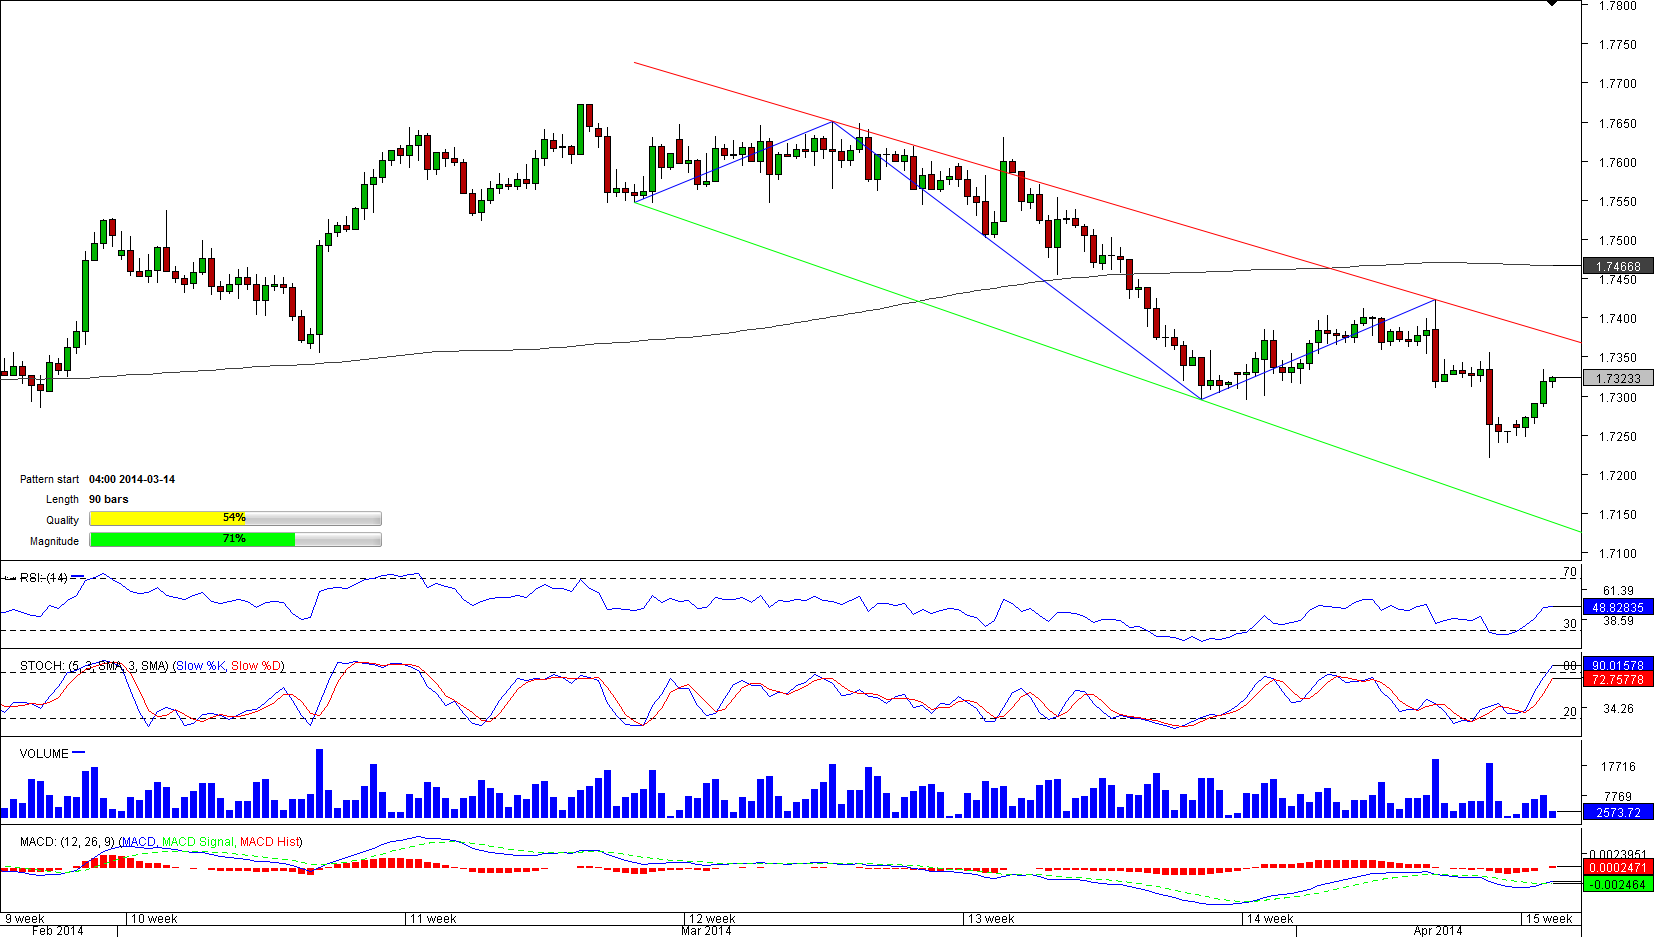
 After peaking at 1.7673 on March 13, the pair began moving downwards and has lost more than 450 pips since then. After touching pattern's resistance on April 3, the pair should, in theory, moved to the south and hit pattern's lower boundary. Nonetheless, the pair is performing another attempt to penetrate the resistance line, and according to aggregate technical indicators on a weekly chart, bulls will manage to do so in a long-term perspective. In a shorter term the outlook is still bearish, keeping in mind strongly bearish single currency and ‘sell' signals from technicals on a 4H and daily charts. The key level for further depreciation is a recent low and a daily S3 at 1.7231.

Mon, 07 Apr 2014 14:27:39 GMT
Source: Dukascopy Bank SA
© Dukascopy Bank SA
© Dukascopy Bank SA
Actual Topics
Subscribe to "Fundamental Analysis" feed
تسجيل
كي تعرف المزيد عن منصة تداول دوكاسكوبي بنك للعملات وعقود الفروقات ومعلومات أخرى متعلقة بالتداول,
يرجى الاتصال بنا أو طلب اتصال.
يرجى الاتصال بنا أو طلب اتصال.
للمزيد من المعلومات حول التعاون العملي المحتمل,
يرجى الاتصال بنا او ترك طلب لاعادة الاتصال
يرجى الاتصال بنا او ترك طلب لاعادة الاتصال
للمزيد من المعلومات حول منصة تداول الفوركس\الخيارات الثنائية, السوق السويسري للفوركس و اي معلومات اخرى تتعلق بالتداول,
يرجى الاتصال بنا أو طلب اتصال.
يرجى الاتصال بنا أو طلب اتصال.
كي تعرف المزيد عن منصة تداول دوكاسكوبي بنك للعملات وعقود الفروقات ومعلومات أخرى متعلقة بالتداول,
يرجى الاتصال بنا أو طلب اتصال.
يرجى الاتصال بنا أو طلب اتصال.
للمزيد من المعلومات حول منصة تداول العملات المشفرة\عقود الفروقات\الفوركس, السوق السويسري للفوركس و اي معلومات اخرى تتعلق بالتداول,
يرجى الاتصال بنا أو طلب اتصال.
يرجى الاتصال بنا أو طلب اتصال.
للمزيد من المعلومات عن الوسطاء المعرفين واي معلومات أخرى متعلقة بالتداول,
يرجى الاتصال بنا أو طلب اتصال.
يرجى الاتصال بنا أو طلب اتصال.
للمزيد من المعلومات حول التعاون العملي المحتمل,
يرجى الاتصال بنا او ترك طلب لاعادة الاتصال
يرجى الاتصال بنا او ترك طلب لاعادة الاتصال