Now the pair is siting above the 50-hour SMA that started to act as a strong support level six hours ago when the currency pair bounced off the lower boundary of the pattern. In the meantime, technical indicators suggest a weakness in the short and medium term that, if materializes, may push the pair again to the pattern's lower boundary.
Note: This section contains information in English only.
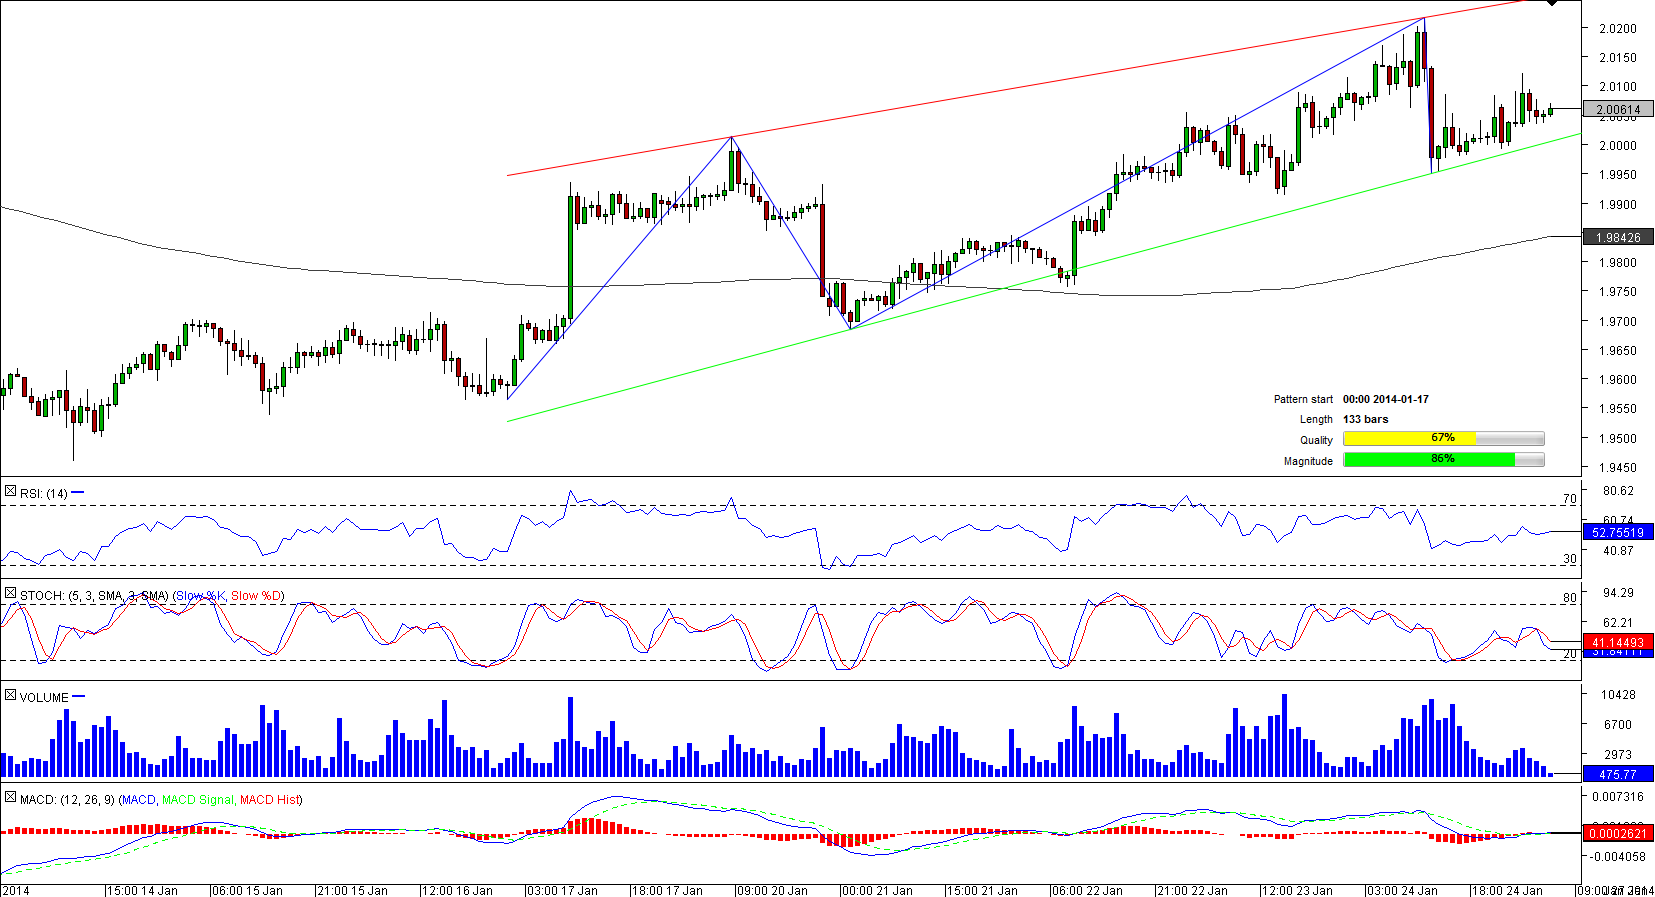
 A decline to a two-month low of 1.9460 in mid-January marked the beginning of the rising wedge pattern, vacillating within which the pair managed not only to recover losses some of the previous losses but also to climb to a three-week high at 2.0216 on January 24.
Now the pair is siting above the 50-hour SMA that started to act as a strong support level six hours ago when the currency pair bounced off the lower boundary of the pattern. In the meantime, technical indicators suggest a weakness in the short and medium term that, if materializes, may push the pair again to the pattern's lower boundary.

Mon, 27 Jan 2014 07:32:08 GMT
Source: Dukascopy Bank SA
© Dukascopy Bank SA
Now the pair is siting above the 50-hour SMA that started to act as a strong support level six hours ago when the currency pair bounced off the lower boundary of the pattern. In the meantime, technical indicators suggest a weakness in the short and medium term that, if materializes, may push the pair again to the pattern's lower boundary.
© Dukascopy Bank SA
Actual Topics
Subscribe to "Fundamental Analysis" feed
تسجيل
كي تعرف المزيد عن منصة تداول دوكاسكوبي بنك للعملات وعقود الفروقات ومعلومات أخرى متعلقة بالتداول,
يرجى الاتصال بنا أو طلب اتصال.
يرجى الاتصال بنا أو طلب اتصال.
للمزيد من المعلومات حول التعاون العملي المحتمل,
يرجى الاتصال بنا او ترك طلب لاعادة الاتصال
يرجى الاتصال بنا او ترك طلب لاعادة الاتصال
للمزيد من المعلومات حول منصة تداول الفوركس\الخيارات الثنائية, السوق السويسري للفوركس و اي معلومات اخرى تتعلق بالتداول,
يرجى الاتصال بنا أو طلب اتصال.
يرجى الاتصال بنا أو طلب اتصال.
كي تعرف المزيد عن منصة تداول دوكاسكوبي بنك للعملات وعقود الفروقات ومعلومات أخرى متعلقة بالتداول,
يرجى الاتصال بنا أو طلب اتصال.
يرجى الاتصال بنا أو طلب اتصال.
للمزيد من المعلومات حول منصة تداول العملات المشفرة\عقود الفروقات\الفوركس, السوق السويسري للفوركس و اي معلومات اخرى تتعلق بالتداول,
يرجى الاتصال بنا أو طلب اتصال.
يرجى الاتصال بنا أو طلب اتصال.
للمزيد من المعلومات عن الوسطاء المعرفين واي معلومات أخرى متعلقة بالتداول,
يرجى الاتصال بنا أو طلب اتصال.
يرجى الاتصال بنا أو طلب اتصال.
للمزيد من المعلومات حول التعاون العملي المحتمل,
يرجى الاتصال بنا او ترك طلب لاعادة الاتصال
يرجى الاتصال بنا او ترك طلب لاعادة الاتصال