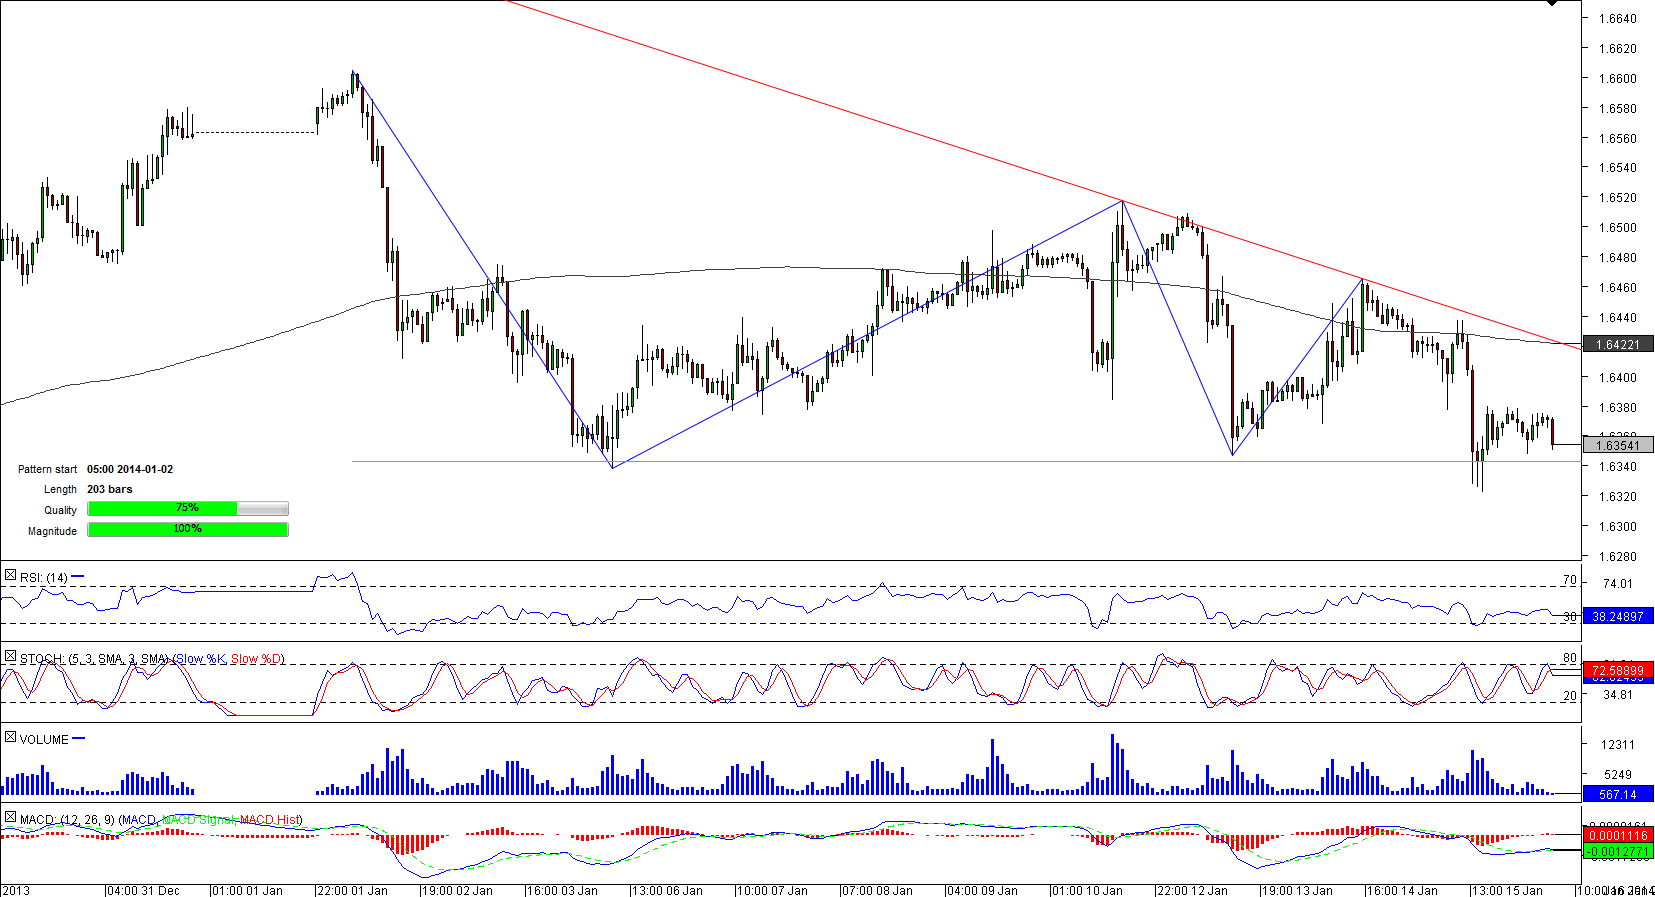
At the moment, the trading range of GBP/USD is narrowing, meaning that the pair is approaching the apex. The closer the pair moves to the apex, the more probable the breakout is. Considering that descending triangles usually lead to bearish breakouts and that 56% of traders bet on depreciation of the pair, the likelihood of an accelerating decline is high in the hours to come.
Note: This section contains information in English only.
 The beginning of 2014 was marked as a time of large swigs performed by the British currency against the greenback after trading almost flat for more than a month. The trajectory of these fluctuations represents the descending triangle pattern that now is 203-bar long.
At the moment, the trading range of GBP/USD is narrowing, meaning that the pair is approaching the apex. The closer the pair moves to the apex, the more probable the breakout is. Considering that descending triangles usually lead to bearish breakouts and that 56% of traders bet on depreciation of the pair, the likelihood of an accelerating decline is high in the hours to come.

Thu, 16 Jan 2014 07:53:59 GMT
Source: Dukascopy Bank SA
© Dukascopy Bank SA
At the moment, the trading range of GBP/USD is narrowing, meaning that the pair is approaching the apex. The closer the pair moves to the apex, the more probable the breakout is. Considering that descending triangles usually lead to bearish breakouts and that 56% of traders bet on depreciation of the pair, the likelihood of an accelerating decline is high in the hours to come.
© Dukascopy Bank SA
Actual Topics
Subscribe to "Fundamental Analysis" feed
تسجيل
كي تعرف المزيد عن منصة تداول دوكاسكوبي بنك للعملات وعقود الفروقات ومعلومات أخرى متعلقة بالتداول,
يرجى الاتصال بنا أو طلب اتصال.
يرجى الاتصال بنا أو طلب اتصال.
للمزيد من المعلومات حول التعاون العملي المحتمل,
يرجى الاتصال بنا او ترك طلب لاعادة الاتصال
يرجى الاتصال بنا او ترك طلب لاعادة الاتصال
للمزيد من المعلومات حول منصة تداول الفوركس\الخيارات الثنائية, السوق السويسري للفوركس و اي معلومات اخرى تتعلق بالتداول,
يرجى الاتصال بنا أو طلب اتصال.
يرجى الاتصال بنا أو طلب اتصال.
كي تعرف المزيد عن منصة تداول دوكاسكوبي بنك للعملات وعقود الفروقات ومعلومات أخرى متعلقة بالتداول,
يرجى الاتصال بنا أو طلب اتصال.
يرجى الاتصال بنا أو طلب اتصال.
للمزيد من المعلومات حول منصة تداول العملات المشفرة\عقود الفروقات\الفوركس, السوق السويسري للفوركس و اي معلومات اخرى تتعلق بالتداول,
يرجى الاتصال بنا أو طلب اتصال.
يرجى الاتصال بنا أو طلب اتصال.
للمزيد من المعلومات عن الوسطاء المعرفين واي معلومات أخرى متعلقة بالتداول,
يرجى الاتصال بنا أو طلب اتصال.
يرجى الاتصال بنا أو طلب اتصال.
للمزيد من المعلومات حول التعاون العملي المحتمل,
يرجى الاتصال بنا او ترك طلب لاعادة الاتصال
يرجى الاتصال بنا او ترك طلب لاعادة الاتصال