Note: This section contains information in English only.
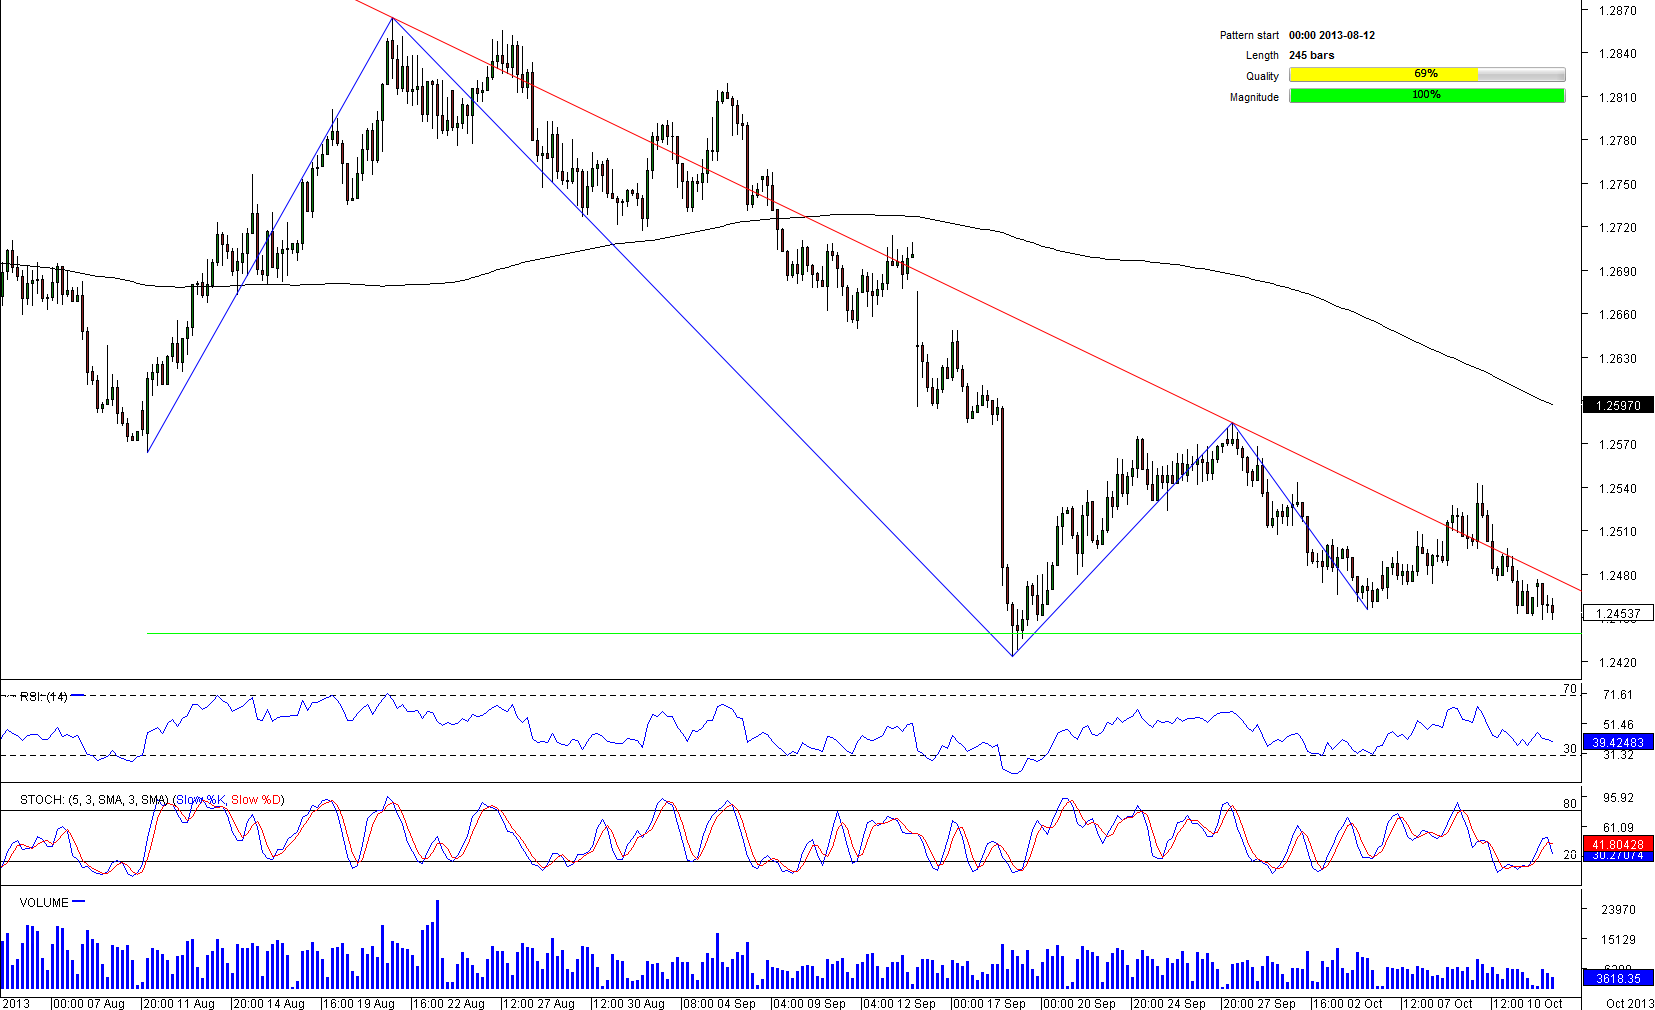
 USD/SGD currency pair has formed a descending triangle pattern on the August 12 and it seems the pattern is moving to its apex as both trend lines will converge on October 18– a day after a possible U.S. default. Despite the result of budget talks in the White House the pair can be highly volatile. Recently, bulls made an attempt to perform an upside breakout, however, the price moved back in pattern's boundaries. The market sentiment is not clearly marked, while indicators are rather neutral or sending "sell" signals. Therefore, not later than until Friday the pair will perform a breakout in any direction, meaning traders can make significant profits in a short period of time.

Mon, 14 Oct 2013 12:42:39 GMT
Source: Dukascopy Bank SA
© Dukascopy Bank SA
© Dukascopy Bank SA
Actual Topics
Subscribe to "Fundamental Analysis" feed
تسجيل
كي تعرف المزيد عن منصة تداول دوكاسكوبي بنك للعملات وعقود الفروقات ومعلومات أخرى متعلقة بالتداول,
يرجى الاتصال بنا أو طلب اتصال.
يرجى الاتصال بنا أو طلب اتصال.
للمزيد من المعلومات حول التعاون العملي المحتمل,
يرجى الاتصال بنا او ترك طلب لاعادة الاتصال
يرجى الاتصال بنا او ترك طلب لاعادة الاتصال
للمزيد من المعلومات حول منصة تداول الفوركس\الخيارات الثنائية, السوق السويسري للفوركس و اي معلومات اخرى تتعلق بالتداول,
يرجى الاتصال بنا أو طلب اتصال.
يرجى الاتصال بنا أو طلب اتصال.
كي تعرف المزيد عن منصة تداول دوكاسكوبي بنك للعملات وعقود الفروقات ومعلومات أخرى متعلقة بالتداول,
يرجى الاتصال بنا أو طلب اتصال.
يرجى الاتصال بنا أو طلب اتصال.
للمزيد من المعلومات حول منصة تداول العملات المشفرة\عقود الفروقات\الفوركس, السوق السويسري للفوركس و اي معلومات اخرى تتعلق بالتداول,
يرجى الاتصال بنا أو طلب اتصال.
يرجى الاتصال بنا أو طلب اتصال.
للمزيد من المعلومات عن الوسطاء المعرفين واي معلومات أخرى متعلقة بالتداول,
يرجى الاتصال بنا أو طلب اتصال.
يرجى الاتصال بنا أو طلب اتصال.
للمزيد من المعلومات حول التعاون العملي المحتمل,
يرجى الاتصال بنا او ترك طلب لاعادة الاتصال
يرجى الاتصال بنا او ترك طلب لاعادة الاتصال