Note: This section contains information in English only.


Wed, 25 Sep 2013 07:27:13 GMT
Source: Dukascopy Bank SA
© Dukascopy Bank SA
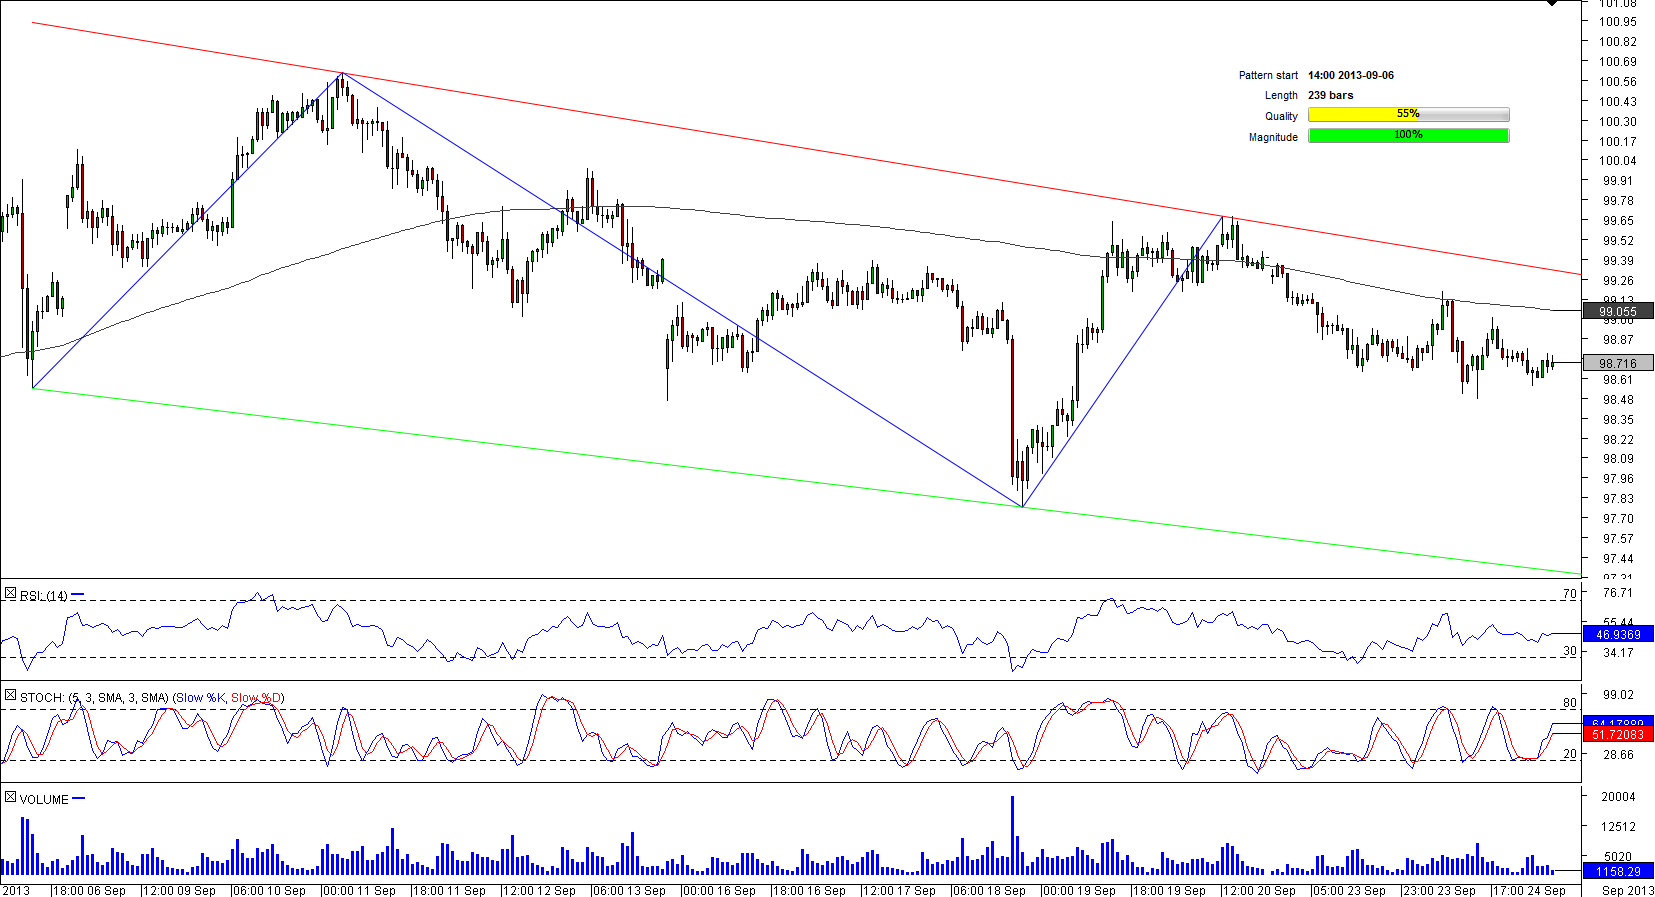
If we connect the most prominent valleys and peaks of USD/JPY hourly chart that have appeared since Sep 6 with straight lines, we would get a bearish channel. And even though the parallel trend-lines that are supposedly guiding the currency pair lower have not yet been confirmed on many occasions, there is a good chance this corridor will prove to be important in the future.
Meanwhile, the bias towards USD/JPY is strongly bearish. Apart from the numerous ‘sell' signals on hourly, four-hour and daily charts, the price fluctuates beneath the 200-hour SMA, a fact that means existence of additional downward pressure on the U.S. Dollar relative to the Yen.
© Dukascopy Bank SA
Actual Topics
Subscribe to "Fundamental Analysis" feed
تسجيل
كي تعرف المزيد عن منصة تداول دوكاسكوبي بنك للعملات وعقود الفروقات ومعلومات أخرى متعلقة بالتداول,
يرجى الاتصال بنا أو طلب اتصال.
يرجى الاتصال بنا أو طلب اتصال.
للمزيد من المعلومات حول التعاون العملي المحتمل,
يرجى الاتصال بنا او ترك طلب لاعادة الاتصال
يرجى الاتصال بنا او ترك طلب لاعادة الاتصال
للمزيد من المعلومات حول منصة تداول الفوركس\الخيارات الثنائية, السوق السويسري للفوركس و اي معلومات اخرى تتعلق بالتداول,
يرجى الاتصال بنا أو طلب اتصال.
يرجى الاتصال بنا أو طلب اتصال.
كي تعرف المزيد عن منصة تداول دوكاسكوبي بنك للعملات وعقود الفروقات ومعلومات أخرى متعلقة بالتداول,
يرجى الاتصال بنا أو طلب اتصال.
يرجى الاتصال بنا أو طلب اتصال.
للمزيد من المعلومات حول منصة تداول العملات المشفرة\عقود الفروقات\الفوركس, السوق السويسري للفوركس و اي معلومات اخرى تتعلق بالتداول,
يرجى الاتصال بنا أو طلب اتصال.
يرجى الاتصال بنا أو طلب اتصال.
للمزيد من المعلومات عن الوسطاء المعرفين واي معلومات أخرى متعلقة بالتداول,
يرجى الاتصال بنا أو طلب اتصال.
يرجى الاتصال بنا أو طلب اتصال.
للمزيد من المعلومات حول التعاون العملي المحتمل,
يرجى الاتصال بنا او ترك طلب لاعادة الاتصال
يرجى الاتصال بنا او ترك طلب لاعادة الاتصال