Confirmation of this reversal hinges on price clearing the 20 SMA and breaking decisively above the 4,600–4,700 neckline on sustained momentum. A verified breakout would project a classic measured move of approximately 650 points—the vertical distance from support to neckline—pointing toward a technical upside target near 5,300.000–5,400.000 to retest early-2026 swing highs. Conversely, should the current bounce fail and price register a daily close below the solid blue support line (< 3,980.000), the double bottom pattern will be fully invalidated, indicating a continuation of the broader downtrend.
Note: This section contains information in English only.
XAU/USD chart displays a developing double bottom formed against major psychological and horizontal support at 4,000.000. The first trough materialized in July 2026 around the 4,000 mark before rebounding toward an intermediate peak between 4,600 and 4,700, which now serves as the pattern's neckline. The second trough is currently forming as price pulls back into the 4,000–4,150 zone, printing a small stabilization candle at 4,152.735. Because this current low holds slightly above the July base, it demonstrates early buyer defense; however, upside momentum remains capped beneath the descending 20-period Simple Moving Average.
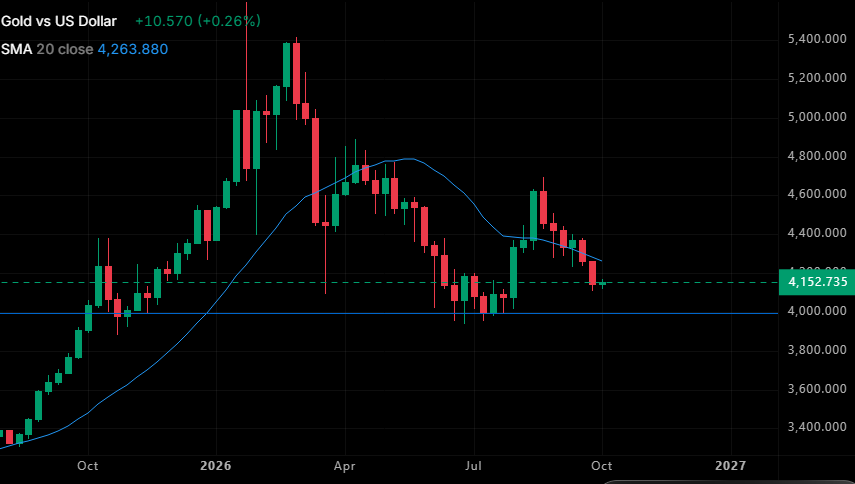
Confirmation of this reversal hinges on price clearing the 20 SMA and breaking decisively above the 4,600–4,700 neckline on sustained momentum. A verified breakout would project a classic measured move of approximately 650 points—the vertical distance from support to neckline—pointing toward a technical upside target near 5,300.000–5,400.000 to retest early-2026 swing highs. Conversely, should the current bounce fail and price register a daily close below the solid blue support line (< 3,980.000), the double bottom pattern will be fully invalidated, indicating a continuation of the broader downtrend.
Mon, 05 Oct 2026 13:32:17 GMT
Source: Dukascopy Bank SA
Confirmation of this reversal hinges on price clearing the 20 SMA and breaking decisively above the 4,600–4,700 neckline on sustained momentum. A verified breakout would project a classic measured move of approximately 650 points—the vertical distance from support to neckline—pointing toward a technical upside target near 5,300.000–5,400.000 to retest early-2026 swing highs. Conversely, should the current bounce fail and price register a daily close below the solid blue support line (< 3,980.000), the double bottom pattern will be fully invalidated, indicating a continuation of the broader downtrend.
Actual Topics
كي تعرف المزيد عن منصة تداول دوكاسكوبي بنك للعملات وعقود الفروقات ومعلومات أخرى متعلقة بالتداول,
يرجى الاتصال بنا أو طلب اتصال.
يرجى الاتصال بنا أو طلب اتصال.
للمزيد من المعلومات حول التعاون العملي المحتمل,
يرجى الاتصال بنا او ترك طلب لاعادة الاتصال
يرجى الاتصال بنا او ترك طلب لاعادة الاتصال
للمزيد من المعلومات حول منصة تداول الفوركس\الخيارات الثنائية, السوق السويسري للفوركس و اي معلومات اخرى تتعلق بالتداول,
يرجى الاتصال بنا أو طلب اتصال.
يرجى الاتصال بنا أو طلب اتصال.
كي تعرف المزيد عن منصة تداول دوكاسكوبي بنك للعملات وعقود الفروقات ومعلومات أخرى متعلقة بالتداول,
يرجى الاتصال بنا أو طلب اتصال.
يرجى الاتصال بنا أو طلب اتصال.
للمزيد من المعلومات حول منصة تداول العملات المشفرة\عقود الفروقات\الفوركس, السوق السويسري للفوركس و اي معلومات اخرى تتعلق بالتداول,
يرجى الاتصال بنا أو طلب اتصال.
يرجى الاتصال بنا أو طلب اتصال.
للمزيد من المعلومات عن الوسطاء المعرفين واي معلومات أخرى متعلقة بالتداول,
يرجى الاتصال بنا أو طلب اتصال.
يرجى الاتصال بنا أو طلب اتصال.
للمزيد من المعلومات حول التعاون العملي المحتمل,
يرجى الاتصال بنا او ترك طلب لاعادة الاتصال
يرجى الاتصال بنا او ترك طلب لاعادة الاتصال