Note: This section contains information in English only.
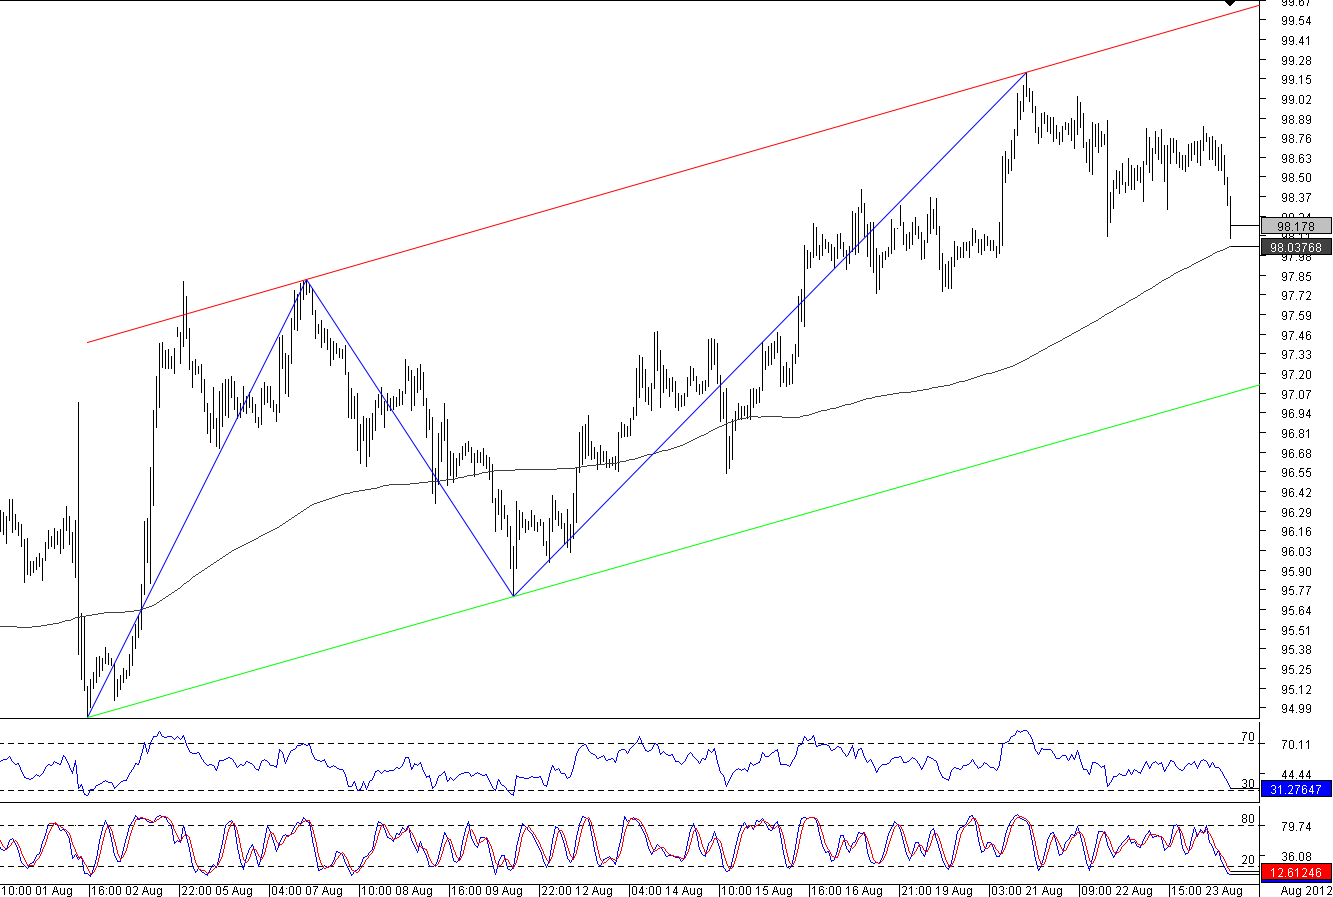
 EUR/JPY has formed an extended Channel Up pattern since the morning on 1H chart. The pattern has 69% quality and 94% magnitude in the 314-bar period.

Fri, 24 Aug 2012 12:38:49 GMT
Source: Dukascopy Bank SA
© Dukascopy Bank SA
The pattern started when the pair bounced from 94.929 and slowed down slightly above 200 day SMA at 98.178 where the pair is currently trading. Technical indicators on aggregate point at appreciation of the pair on 1D time horizon suggesting that the pair will continue to follow pattern's trend. Long traders could set their targets at daily pivot (S1)/Fibonacci (23.6% of move since August 10) at 98.373/385 and daily pivot (PP) at 98.609.
Technical indicators on aggregate point at depreciation of the pair on 1H and 4H time horizons suggesting that the pair will continue to depreciate and move towards pattern's support. The SWFX market sentiment shows that 51% of traders currently hold short positions on the pair in comparison to 56% holding long positions 8 hours ago. Short traders should set their targets at daily pivot (S2)/200 day SMA at 98.073/044 and daily pivot (S3)/Fibonacci (38.2% of move since August 10) at 97.895.
© Dukascopy Bank SA
Actual Topics
Subscribe to "Fundamental Analysis" feed
تسجيل
كي تعرف المزيد عن منصة تداول دوكاسكوبي بنك للعملات وعقود الفروقات ومعلومات أخرى متعلقة بالتداول,
يرجى الاتصال بنا أو طلب اتصال.
يرجى الاتصال بنا أو طلب اتصال.
للمزيد من المعلومات حول التعاون العملي المحتمل,
يرجى الاتصال بنا او ترك طلب لاعادة الاتصال
يرجى الاتصال بنا او ترك طلب لاعادة الاتصال
للمزيد من المعلومات حول منصة تداول الفوركس\الخيارات الثنائية, السوق السويسري للفوركس و اي معلومات اخرى تتعلق بالتداول,
يرجى الاتصال بنا أو طلب اتصال.
يرجى الاتصال بنا أو طلب اتصال.
كي تعرف المزيد عن منصة تداول دوكاسكوبي بنك للعملات وعقود الفروقات ومعلومات أخرى متعلقة بالتداول,
يرجى الاتصال بنا أو طلب اتصال.
يرجى الاتصال بنا أو طلب اتصال.
للمزيد من المعلومات حول منصة تداول العملات المشفرة\عقود الفروقات\الفوركس, السوق السويسري للفوركس و اي معلومات اخرى تتعلق بالتداول,
يرجى الاتصال بنا أو طلب اتصال.
يرجى الاتصال بنا أو طلب اتصال.
للمزيد من المعلومات عن الوسطاء المعرفين واي معلومات أخرى متعلقة بالتداول,
يرجى الاتصال بنا أو طلب اتصال.
يرجى الاتصال بنا أو طلب اتصال.
للمزيد من المعلومات حول التعاون العملي المحتمل,
يرجى الاتصال بنا او ترك طلب لاعادة الاتصال
يرجى الاتصال بنا او ترك طلب لاعادة الاتصال