Note: This section contains information in English only.
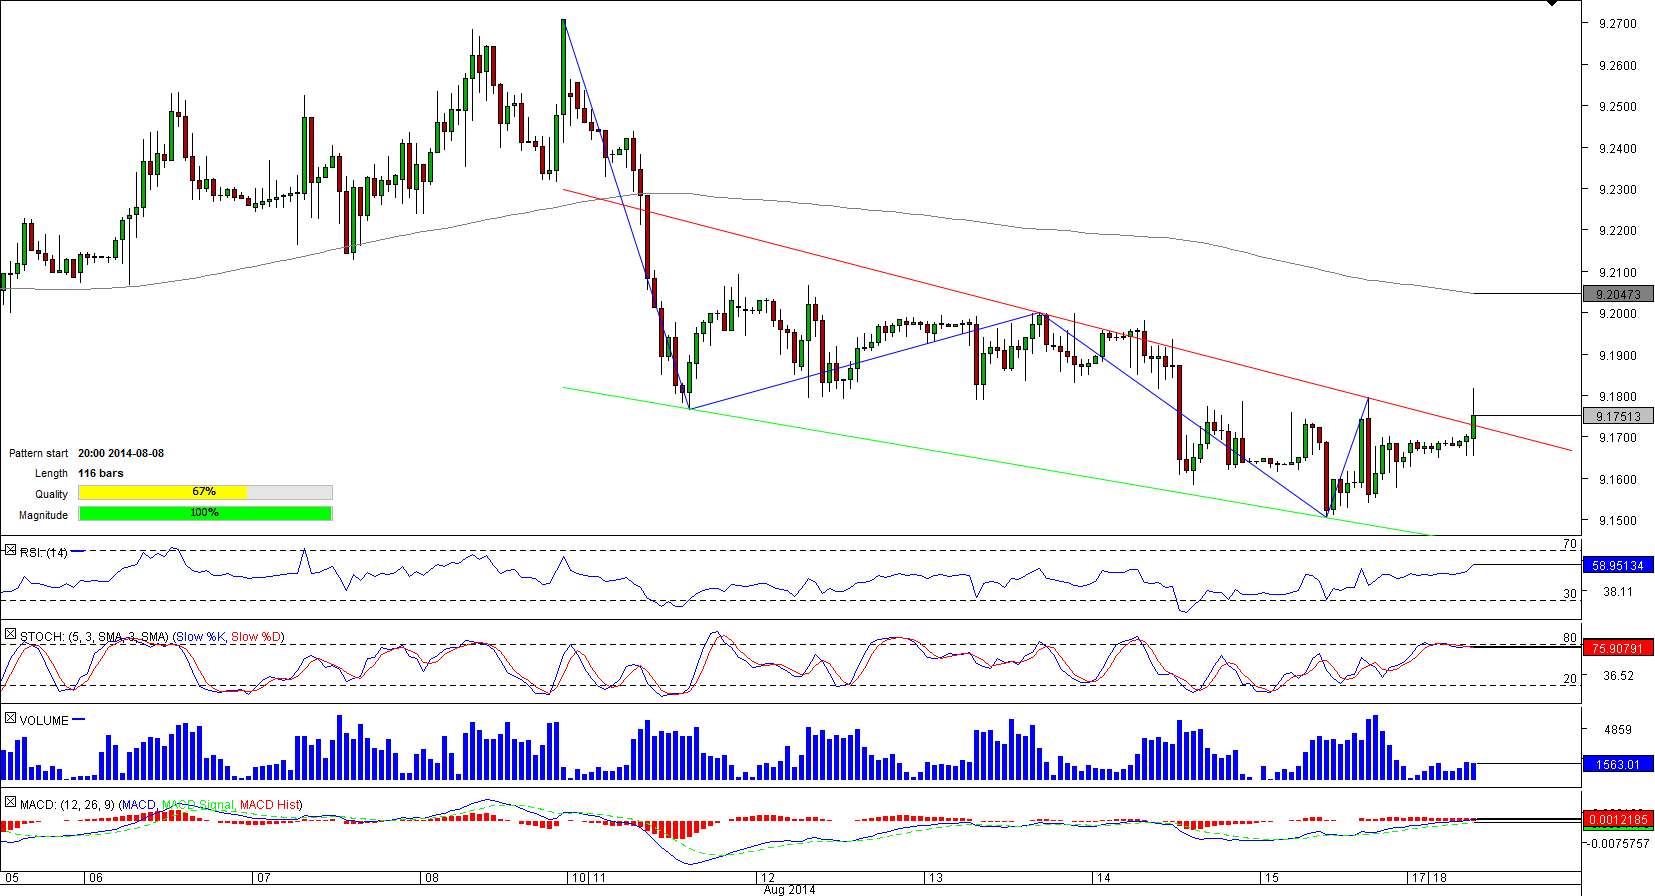
 At the beginning of August EUR/SEK was trading in a sideways trend; however, on 8th day of the month a downward sloping channel started to form. The pair recently (on 3th of July) reached the highest level in more than three years at 9.3908. Nonetheless, the Euro was not able to hold its positions that high and started to tumble lower. At the moment, the pair is trading around the Falling Wedge pattern's resistance line and a break-out is possible as the Falling Wedge pattern in most basic level is considered a bullish trend. Also, the 1H technical studies are mostly bullish; although, if the resistance line will hold then a decline towards 9.14 is likely.

Mon, 18 Aug 2014 07:48:17 GMT
Source: Dukascopy Bank SA
© Dukascopy Bank SA
© Dukascopy Bank SA
Actual Topics
Subscribe to "Fundamental Analysis" feed
Subscrever
Para saber mais sobre a plataforma de negociação Dukascopy Bank CFD / Forex, SWFX e outras informações relacionadas com negociação,
por favor entre em contato conosco ou faça um pedido de retorno de chamada.
por favor entre em contato conosco ou faça um pedido de retorno de chamada.
Para obter mais informações sobre uma potencial cooperação,
ligue-nos ou faça-nos um pedido para ser contactado.
ligue-nos ou faça-nos um pedido para ser contactado.
Para saber mais sobre as opções binárias do Dukascopy Bank
/ Plataforma de negociação Forex, SWFX e outras informações relacionadas com Trading,
ligue-nos ou faça-nos um pedido para ser contactado.
ligue-nos ou faça-nos um pedido para ser contactado.
Para saber mais sobre a plataforma de negociação Dukascopy Bank CFD / Forex, SWFX e outras informações relacionadas com negociação,
por favor entre em contato conosco ou faça um pedido de retorno de chamada.
por favor entre em contato conosco ou faça um pedido de retorno de chamada.
Para saber mais sobre a plataforma de Trading / Trading de Crypto/ CFD / SWFX e outras informações relacionadas à negociação,
ligue-nos ou faça-nos uma pedido para ser contactado.
ligue-nos ou faça-nos uma pedido para ser contactado.
Para saber mais sobre o programa de Introdutor de Negócios e outras informações relacionadas à negociação,
ligue-nos ou faça-nos uma pedido para ser contactado.
ligue-nos ou faça-nos uma pedido para ser contactado.
Para obter mais informações sobre uma potencial cooperação,
ligue-nos ou faça-nos um pedido para ser contactado.
ligue-nos ou faça-nos um pedido para ser contactado.