Note: This section contains information in English only.
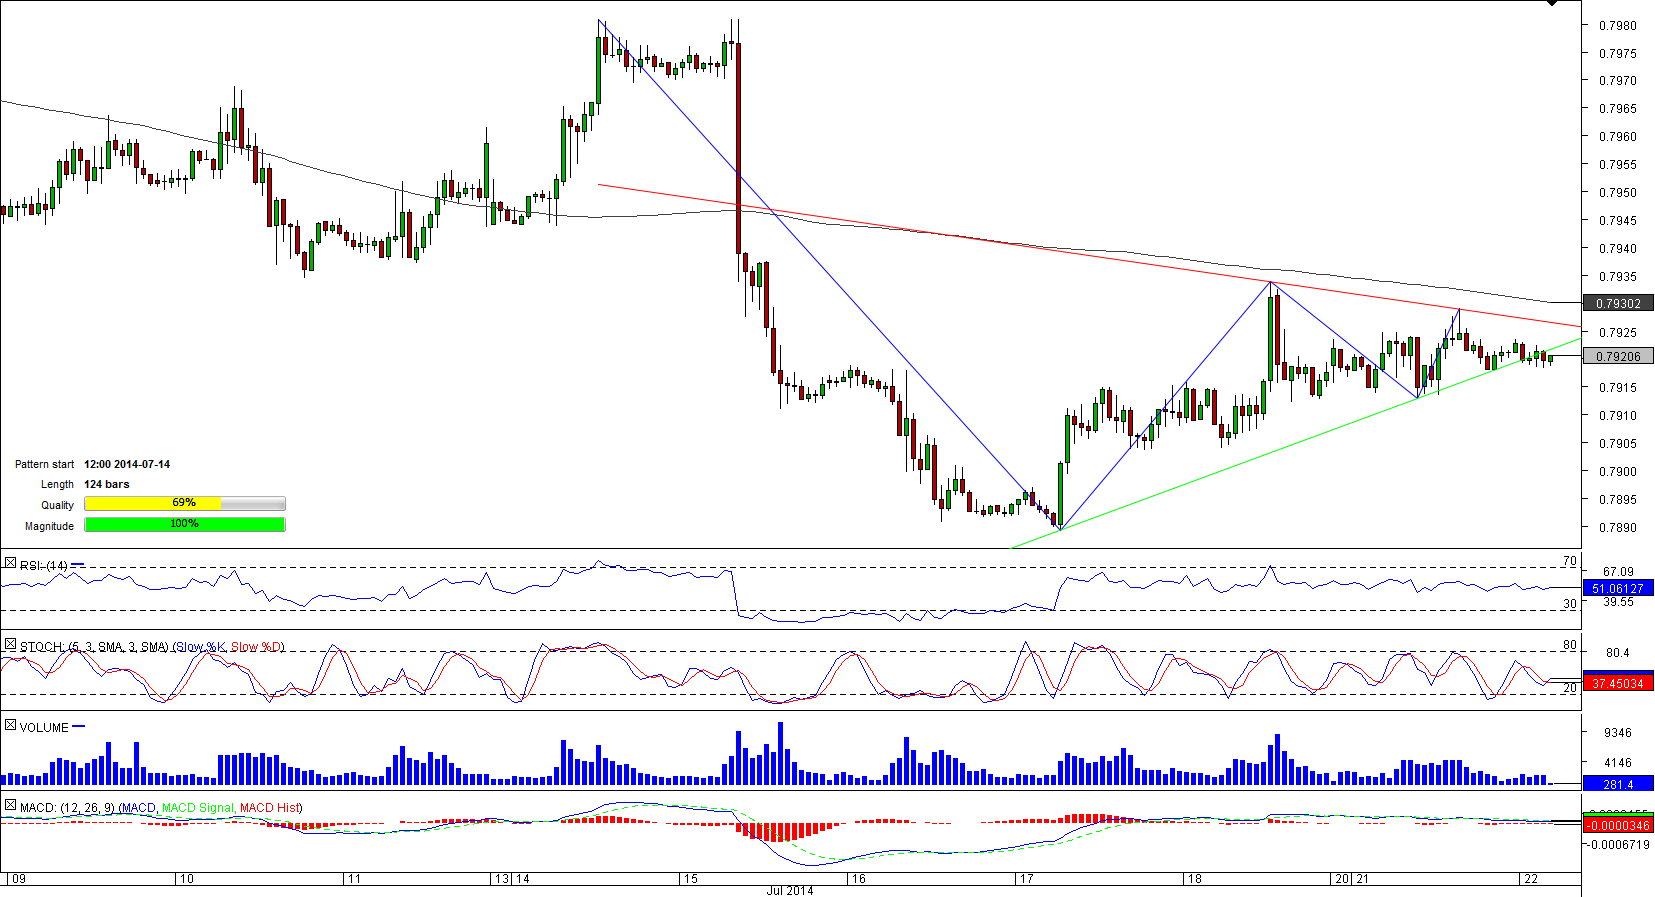
 EUR/GBP has transformed a channel down pattern examined a day earlier into a symmetrical triangle and now the instrument is on the brink of an accelerating decline that often follows a bearish exit this type of patterns. The SWFX numbers prop up this view– two traders out of three hold short positions, meaning EUR/GBP may plunge below the 50-hour SMA and four-hour S1 at 0.7918/7 that act as a strong support zone. If overcome, the short-term SMA may push the mark of 0.7915/3 (four-hour SS2, S3; daily S1) to the fore, below which only two levels – 0.7905 (daily S2) and 0.7898 (daily S3) are capable to stop the downswing.

Tue, 22 Jul 2014 06:29:19 GMT
Source: Dukascopy Bank SA
© Dukascopy Bank SA
© Dukascopy Bank SA
Actual Topics
Subscribe to "Fundamental Analysis" feed
Subscrever
Para saber mais sobre a plataforma de negociação Dukascopy Bank CFD / Forex, SWFX e outras informações relacionadas com negociação,
por favor entre em contato conosco ou faça um pedido de retorno de chamada.
por favor entre em contato conosco ou faça um pedido de retorno de chamada.
Para obter mais informações sobre uma potencial cooperação,
ligue-nos ou faça-nos um pedido para ser contactado.
ligue-nos ou faça-nos um pedido para ser contactado.
Para saber mais sobre as opções binárias do Dukascopy Bank
/ Plataforma de negociação Forex, SWFX e outras informações relacionadas com Trading,
ligue-nos ou faça-nos um pedido para ser contactado.
ligue-nos ou faça-nos um pedido para ser contactado.
Para saber mais sobre a plataforma de negociação Dukascopy Bank CFD / Forex, SWFX e outras informações relacionadas com negociação,
por favor entre em contato conosco ou faça um pedido de retorno de chamada.
por favor entre em contato conosco ou faça um pedido de retorno de chamada.
Para saber mais sobre a plataforma de Trading / Trading de Crypto/ CFD / SWFX e outras informações relacionadas à negociação,
ligue-nos ou faça-nos uma pedido para ser contactado.
ligue-nos ou faça-nos uma pedido para ser contactado.
Para saber mais sobre o programa de Introdutor de Negócios e outras informações relacionadas à negociação,
ligue-nos ou faça-nos uma pedido para ser contactado.
ligue-nos ou faça-nos uma pedido para ser contactado.
Para obter mais informações sobre uma potencial cooperação,
ligue-nos ou faça-nos um pedido para ser contactado.
ligue-nos ou faça-nos um pedido para ser contactado.