Note: This section contains information in English only.


Mon, 21 Apr 2014 07:25:03 GMT
Source: Dukascopy Bank SA
© Dukascopy Bank SA
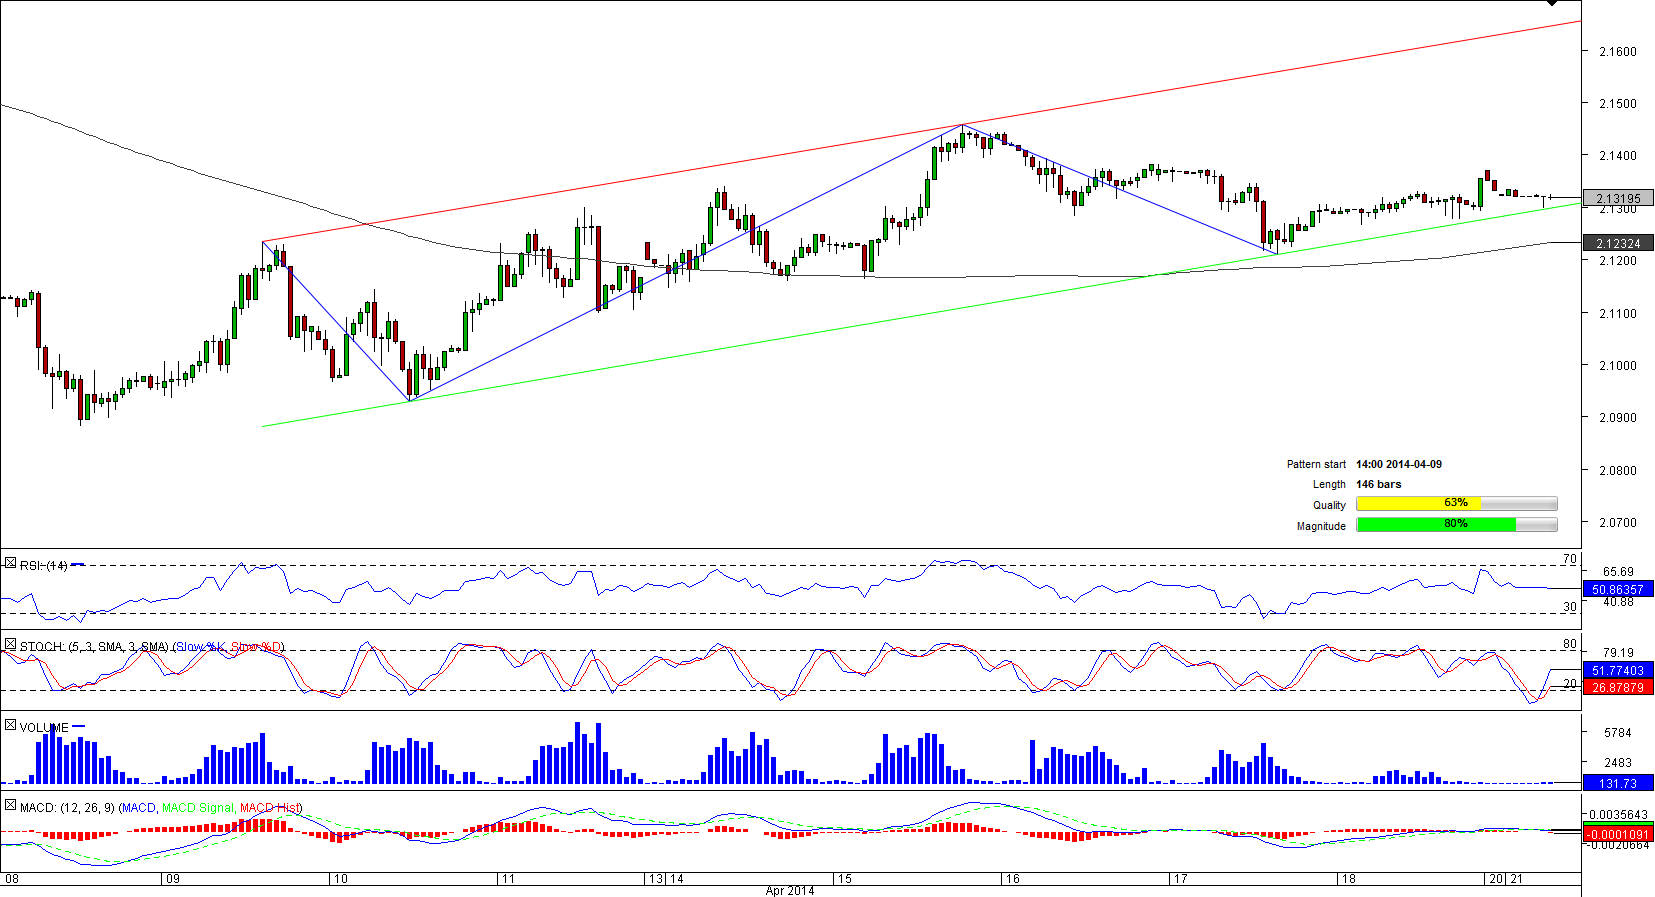
The present situation in USD/TRY is reminiscent of the one currently being observed in USD/ZAR, where the currency pair is also forming an upward-sloping channel starting from Apr 10.
Considering that USD/TRY is currently trading near the lower rising trend-line, the U.S. Dollar is expected to appreciate versus the Turkish Lira in the short run. However, the technical indicators at the moment are mixed and do not support such a course of events. At the same time, the distribution between the bulls and bears is in favour of the latter (58%), meaning a significant part of the SWFX traders believe the greenback is going to cede ground.
© Dukascopy Bank SA
Actual Topics
Subscribe to "Fundamental Analysis" feed
Subscrever
Para saber mais sobre a plataforma de negociação Dukascopy Bank CFD / Forex, SWFX e outras informações relacionadas com negociação,
por favor entre em contato conosco ou faça um pedido de retorno de chamada.
por favor entre em contato conosco ou faça um pedido de retorno de chamada.
Para obter mais informações sobre uma potencial cooperação,
ligue-nos ou faça-nos um pedido para ser contactado.
ligue-nos ou faça-nos um pedido para ser contactado.
Para saber mais sobre as opções binárias do Dukascopy Bank
/ Plataforma de negociação Forex, SWFX e outras informações relacionadas com Trading,
ligue-nos ou faça-nos um pedido para ser contactado.
ligue-nos ou faça-nos um pedido para ser contactado.
Para saber mais sobre a plataforma de negociação Dukascopy Bank CFD / Forex, SWFX e outras informações relacionadas com negociação,
por favor entre em contato conosco ou faça um pedido de retorno de chamada.
por favor entre em contato conosco ou faça um pedido de retorno de chamada.
Para saber mais sobre a plataforma de Trading / Trading de Crypto/ CFD / SWFX e outras informações relacionadas à negociação,
ligue-nos ou faça-nos uma pedido para ser contactado.
ligue-nos ou faça-nos uma pedido para ser contactado.
Para saber mais sobre o programa de Introdutor de Negócios e outras informações relacionadas à negociação,
ligue-nos ou faça-nos uma pedido para ser contactado.
ligue-nos ou faça-nos uma pedido para ser contactado.
Para obter mais informações sobre uma potencial cooperação,
ligue-nos ou faça-nos um pedido para ser contactado.
ligue-nos ou faça-nos um pedido para ser contactado.