Note: This section contains information in English only.
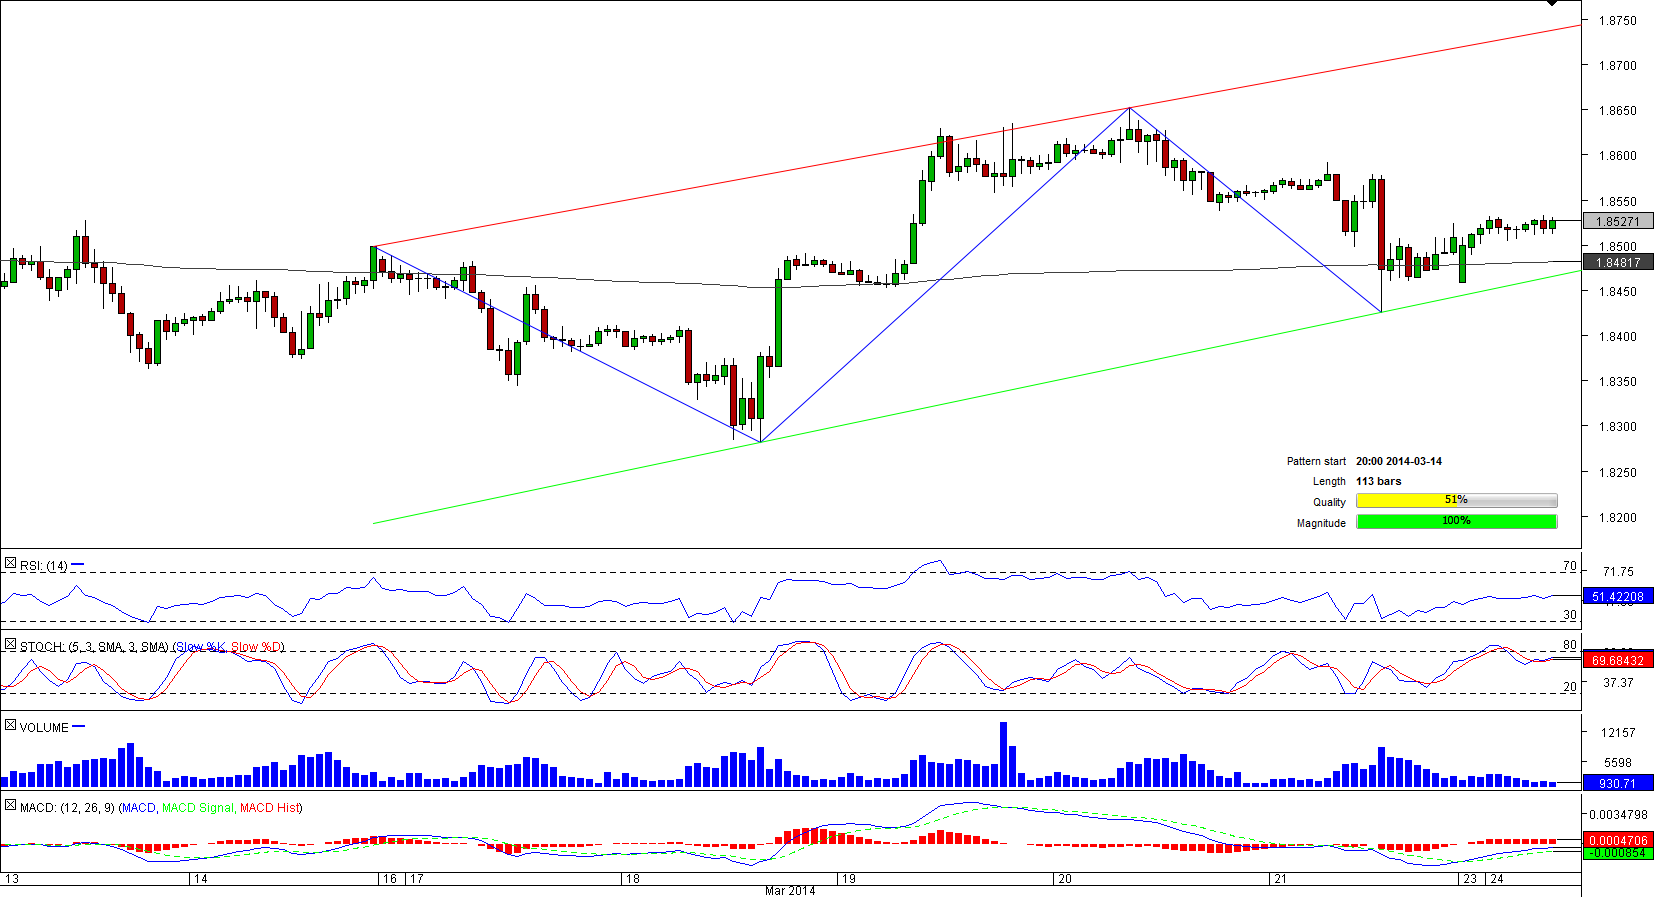
 For the past five trading days GBP/CAD seems to have been trading between two parallel rising trend-lines. For this assumption to prove to be true, the currency pair needs to rebound from the support near 1.85 (200-hour SMA, weekly PP and up-trend); most of the technical indicators favour such a course of events. Then the price will be expected to head towards 1.8750, the upper boundary of the bullish channel, from where in turn it will be expected to undergo a downward correction. However, it must be noted that the SWFX market participants doubt the ability of the Sterling to appreciate— merely 29% of open on the pair positions are long.

Mon, 24 Mar 2014 08:14:19 GMT
Source: Dukascopy Bank SA
© Dukascopy Bank SA
© Dukascopy Bank SA
Actual Topics
Subscribe to "Fundamental Analysis" feed
Subscrever
Para saber mais sobre a plataforma de negociação Dukascopy Bank CFD / Forex, SWFX e outras informações relacionadas com negociação,
por favor entre em contato conosco ou faça um pedido de retorno de chamada.
por favor entre em contato conosco ou faça um pedido de retorno de chamada.
Para obter mais informações sobre uma potencial cooperação,
ligue-nos ou faça-nos um pedido para ser contactado.
ligue-nos ou faça-nos um pedido para ser contactado.
Para saber mais sobre as opções binárias do Dukascopy Bank
/ Plataforma de negociação Forex, SWFX e outras informações relacionadas com Trading,
ligue-nos ou faça-nos um pedido para ser contactado.
ligue-nos ou faça-nos um pedido para ser contactado.
Para saber mais sobre a plataforma de negociação Dukascopy Bank CFD / Forex, SWFX e outras informações relacionadas com negociação,
por favor entre em contato conosco ou faça um pedido de retorno de chamada.
por favor entre em contato conosco ou faça um pedido de retorno de chamada.
Para saber mais sobre a plataforma de Trading / Trading de Crypto/ CFD / SWFX e outras informações relacionadas à negociação,
ligue-nos ou faça-nos uma pedido para ser contactado.
ligue-nos ou faça-nos uma pedido para ser contactado.
Para saber mais sobre o programa de Introdutor de Negócios e outras informações relacionadas à negociação,
ligue-nos ou faça-nos uma pedido para ser contactado.
ligue-nos ou faça-nos uma pedido para ser contactado.
Para obter mais informações sobre uma potencial cooperação,
ligue-nos ou faça-nos um pedido para ser contactado.
ligue-nos ou faça-nos um pedido para ser contactado.