Note: This section contains information in English only.
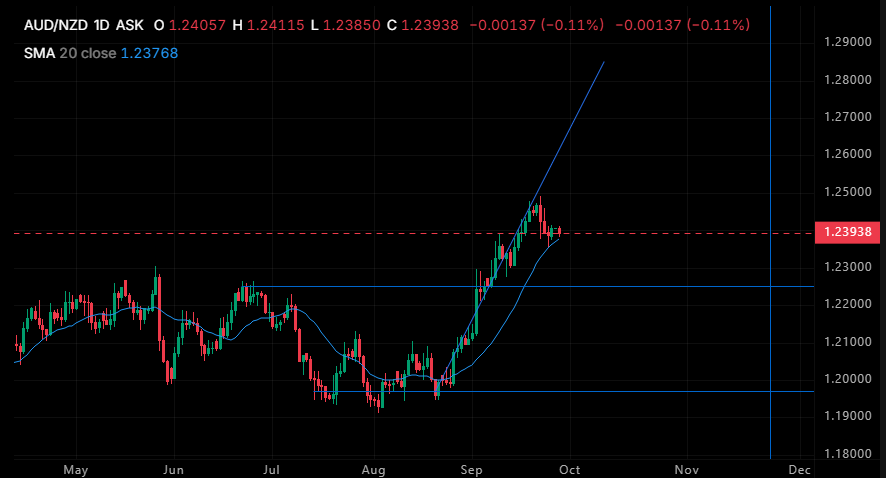
The AUD/NZD chart shows an incomplete cup formation where a rounded bottom developed between late July and mid-August (base floor at 1.1900–1.1940), followed by a sharp breakout past the former 1.2260 left rim without pausing to form a classic pre-breakout handle. Price subsequently surged to 1.2500 and is now undergoing a post-breakout pullback, directly testing dynamic support at the 20-day SMA (1.23768) with current price at 1.23938. Holding this moving average preserves immediate bullish momentum toward a retest of 1.2500 and measured expansion targets up to 1.2800, whereas a decisive breakdown below the 20 SMA risks a deeper corrective retest toward structural polarity support at 1.2260.
Mon, 28 Sep 2026 10:09:20 GMT
Source: Dukascopy Bank SA
Actual Topics
Para saber mais sobre a plataforma de negociação Dukascopy Bank CFD / Forex, SWFX e outras informações relacionadas com negociação,
por favor entre em contato conosco ou faça um pedido de retorno de chamada.
por favor entre em contato conosco ou faça um pedido de retorno de chamada.
Para obter mais informações sobre uma potencial cooperação,
ligue-nos ou faça-nos um pedido para ser contactado.
ligue-nos ou faça-nos um pedido para ser contactado.
Para saber mais sobre as opções binárias do Dukascopy Bank
/ Plataforma de negociação Forex, SWFX e outras informações relacionadas com Trading,
ligue-nos ou faça-nos um pedido para ser contactado.
ligue-nos ou faça-nos um pedido para ser contactado.
Para saber mais sobre a plataforma de negociação Dukascopy Bank CFD / Forex, SWFX e outras informações relacionadas com negociação,
por favor entre em contato conosco ou faça um pedido de retorno de chamada.
por favor entre em contato conosco ou faça um pedido de retorno de chamada.
Para saber mais sobre a plataforma de Trading / Trading de Crypto/ CFD / SWFX e outras informações relacionadas à negociação,
ligue-nos ou faça-nos uma pedido para ser contactado.
ligue-nos ou faça-nos uma pedido para ser contactado.
Para saber mais sobre o programa de Introdutor de Negócios e outras informações relacionadas à negociação,
ligue-nos ou faça-nos uma pedido para ser contactado.
ligue-nos ou faça-nos uma pedido para ser contactado.
Para obter mais informações sobre uma potencial cooperação,
ligue-nos ou faça-nos um pedido para ser contactado.
ligue-nos ou faça-nos um pedido para ser contactado.