MACD - The Moving Average Convergence-Divergence is indicator/oscillator that fluctuates above and below the zero line as the moving averages converge, cross and diverge. "D" in MACD, "divergence" refers to the two underlying moving averages(EMA) move away from each other, while "convergence" refers to the two underlying EMA coming towards each other.Usually MACD uses 12 and 26 EMA period lines. Positive MACD indicates that the 12 day EMA(falst) is above the 26 day EMA(slow). Positive values increase as the shorter EMA diverges further from the longer EMA. Negative MACD values indicate that the 12 day EMA is below the 26 day EMA. Negative values increase as the shorter EMA diverges further below the longer EMA
Calculation:
MACD Line: EMA(12) - EMA(26)
Signal Line: 9 day EMA of MACD Line
MACD Histogram: MACD Line - Signal Line
MACD in Visual JForex:
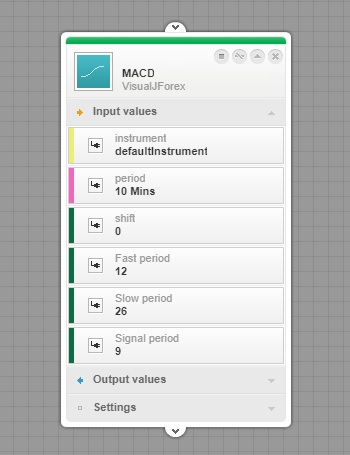
MACD block is located in the Indicator section under the MA categor. |
