General description
One of the basic and popular types of Moving Averages - a simple moving average is calculated by computing the average price over a specified number of periods.
Simple moving average is a so called lagging indicator, since it is calculated using past prices (calculation is generally based on closing prices).
Despite this lag, moving averages help smooth price action and filter out the noise.
This indicator may be used as support-resistance level and help identify the direction of trend.
A cross of long-term and short-term moving averages is a popular way of identifying a trend change.
SMA is calculated using the following formula: ΣPn/n, where n is the number of periods, or bars to calculate the SMA over, and Pn is the price for period n.
SMA in Visual JForex

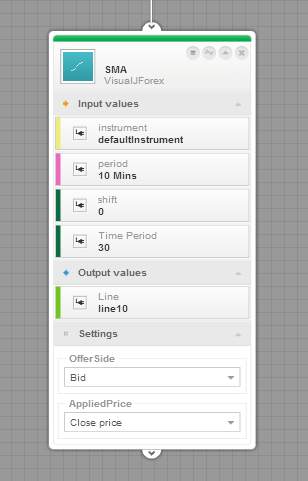
SMA block is located in the Indicator section under the MA category. Drag and drop the block on the board, connect it with another block or click and create a variable of type Double to store the calculation result.
Input variables are used to set up indicator for calculation, things like range of values (prices) used in calculation, timeframe (10 Mins, 1 Hour, etc), Instrument and so on.
Output values (or variables) store the result of indicator calculation. These variables may later be referenced from another blocks like, for example, logical expressions that result in trading decisions made by the Visual JForex strategy.
The settings section of SMA block contains offerside (Bid or Ask) and applied price (Open, Close, etc) settings.
Instrument, Period, OfferSide and AppliedPrice together describe the source of SMA indicator input data.
The following visual strategies use SMA in their logic: SMA Cross Example, SMA Cross Example strategy. These strategies are based on cross of two SMA indicators. |
