Dear Support,
Or anyone else with more experience with Renkos.
Please take a look on the following screenshot. This is a Historical Test run of a Renko strategy, but I think something is not correct:
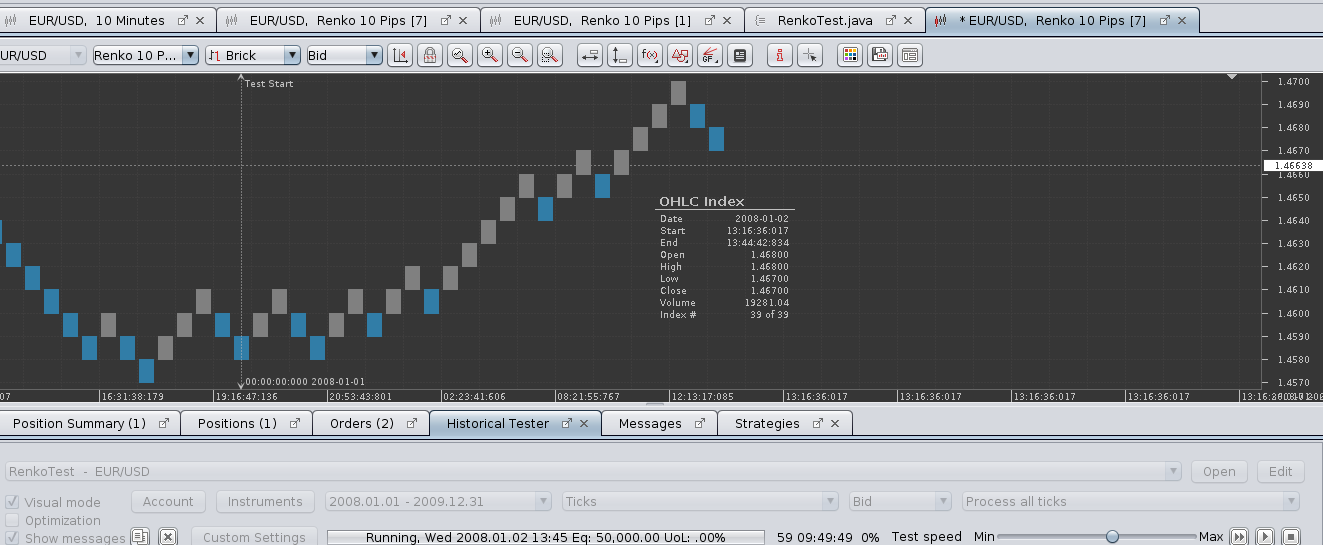
As far as I know, a Renko bar is generated whenever the price changes more than the price range of the Renko brick. On the screenshot above we see a 10 pip Renko chart. The last candle drawn is for prices from 1.4680 to 1.4670. (The mouse cursor not visible, but the OHLC informer is showing data of the last candle.)
The current price of the instrument is 1.46638 (as visible on the right axis), which is way below 1.4670. Why don't we see a new Renko bar drawn (from 1.4670 to 1.4660)? Could someone explain what is going on?


