I want to use patterns (triangles, wedges) on test charts and within a strategy. Are there any examples that show how this can be done? I am finding the data returned very confusing.
As background, I am using this code to add a triangle pattern to a chart within a back test:
   @Override
   public void onStart(IContext context) throws JFException
   {
      super.onStart(context);

      IIndicator indicator = indicators.getIndicator("TRIANGLE");
      indicator.getInputParameterInfo(0).setAppliedPrice(IIndicators.AppliedPrice.CLOSE);
      indicator.setOptInputParameter(0, 1);
      indicator.setOptInputParameter(1, 50.0);
      indicator.setOptInputParameter(2, 1);
      indicator.setOptInputParameter(3, true);

                context.getChart(instrument).add(indicator,
              new Object[] { 1, 50.0, 1, true },
              new Color[] { Color.black, Color.black },
              new DrawingStyle[] { DrawingStyle.LINE, DrawingStyle.LINE },
              new int[] { 2, 2 } );
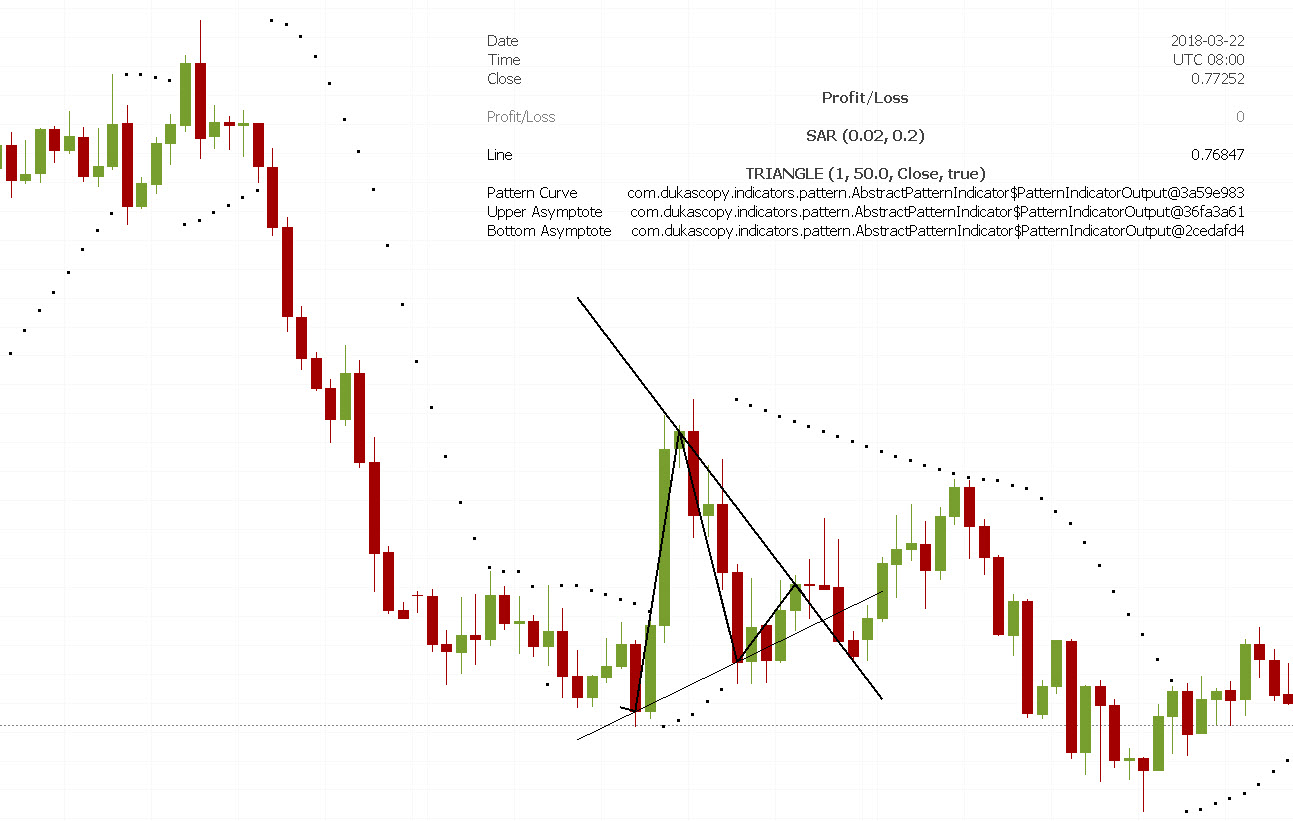
I have added the OhlcInformer to the chart, but the data displayed for the pattern is rather weird (as shown here):
When calculating the triangle pattern, I use the following code:
                private static AppliedPrice[] inputTypes = new AppliedPrice[] { AppliedPrice.CLOSE };
                private static Object[] optionalParameters = new Object[] { 1, 50.0 };
                .....
      Object[] values = indicators.calculateIndicator(instrument, period, offerSides, "TRIANGLE", inputTypes, optionalParameters, 1);
There are three objects in the returned values array. Each item in the array is a PatternIndicatorOutput object which contains null. This doesn't change for any bar on the chart in or around the displayed pattern that I hover over. I'm not sure what should be displayed and how to use the data that is returned.
Any help would be appreciated.


