Dukascopy
 
 
Wiki JStore Search Login

CBar, HLBox, LCI, LCHMA, my set of custom indicators in latest versions
 Post subject: CBar, HLBox, LCI, LCHMA, my set of custom indicators in latest versions Post rating: 0   New post Posted: Sat 21 May, 2016, 15:52 
User avatar

User rating: 2
Joined: Sat 05 May, 2012, 01:28
Posts: 27
Location: IcelandIceland
On quite a big past success(number of downloads, page hits), I am presenting a complete set of my custom made indicators in latest versions. Each with source code included. All of them are modified versions of original Dukascopy`s indicators code(which one is stated in the source code). I am releasing them based on previous agreement with Dukascopy. I will additionally add here that:

- Dukascopy take no responsibility for any modified indicators released by me
- I provide my indicators with no warranty, use at your own risk
- I am releasing them under same unmodified license as original indicators
- You are allowed to use them for your own personal use, disallowed for any commercial use or to sell them

Now after boring part is done, lets start:

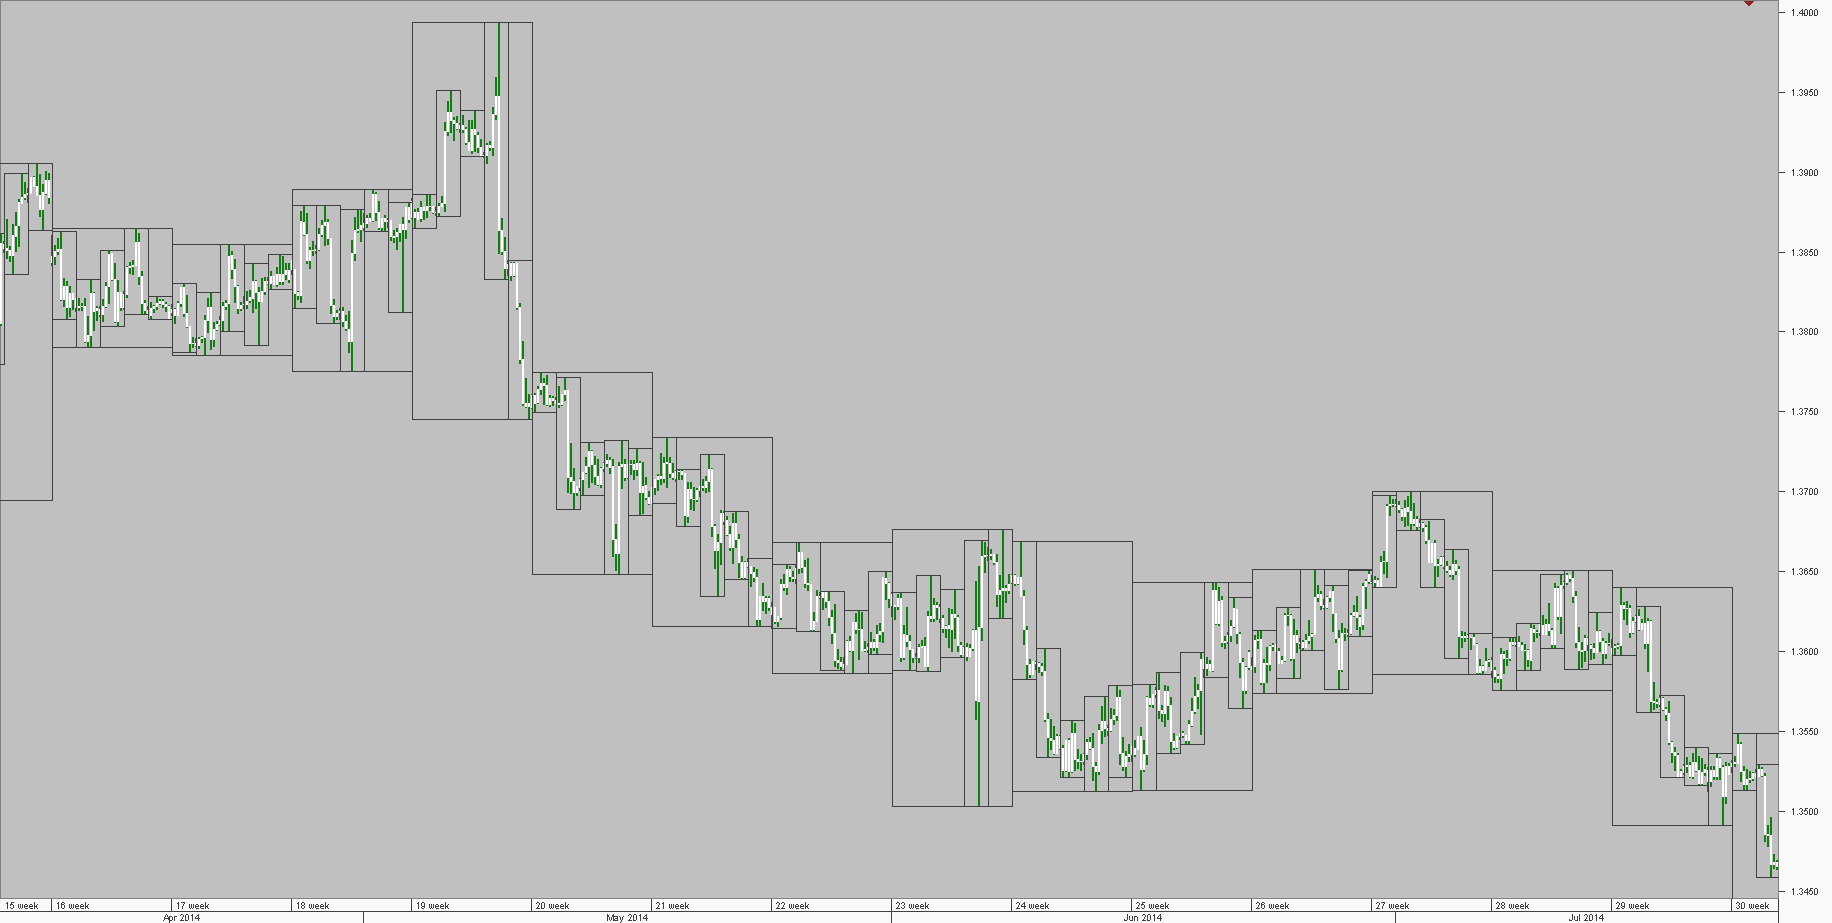
HLBox(updated to v1.2):

This indicator allow you to paint higher timeframe(tf) bars on lower tf chart. You could for example have a weekly and/or daily bar on 1h tf like this:

Image

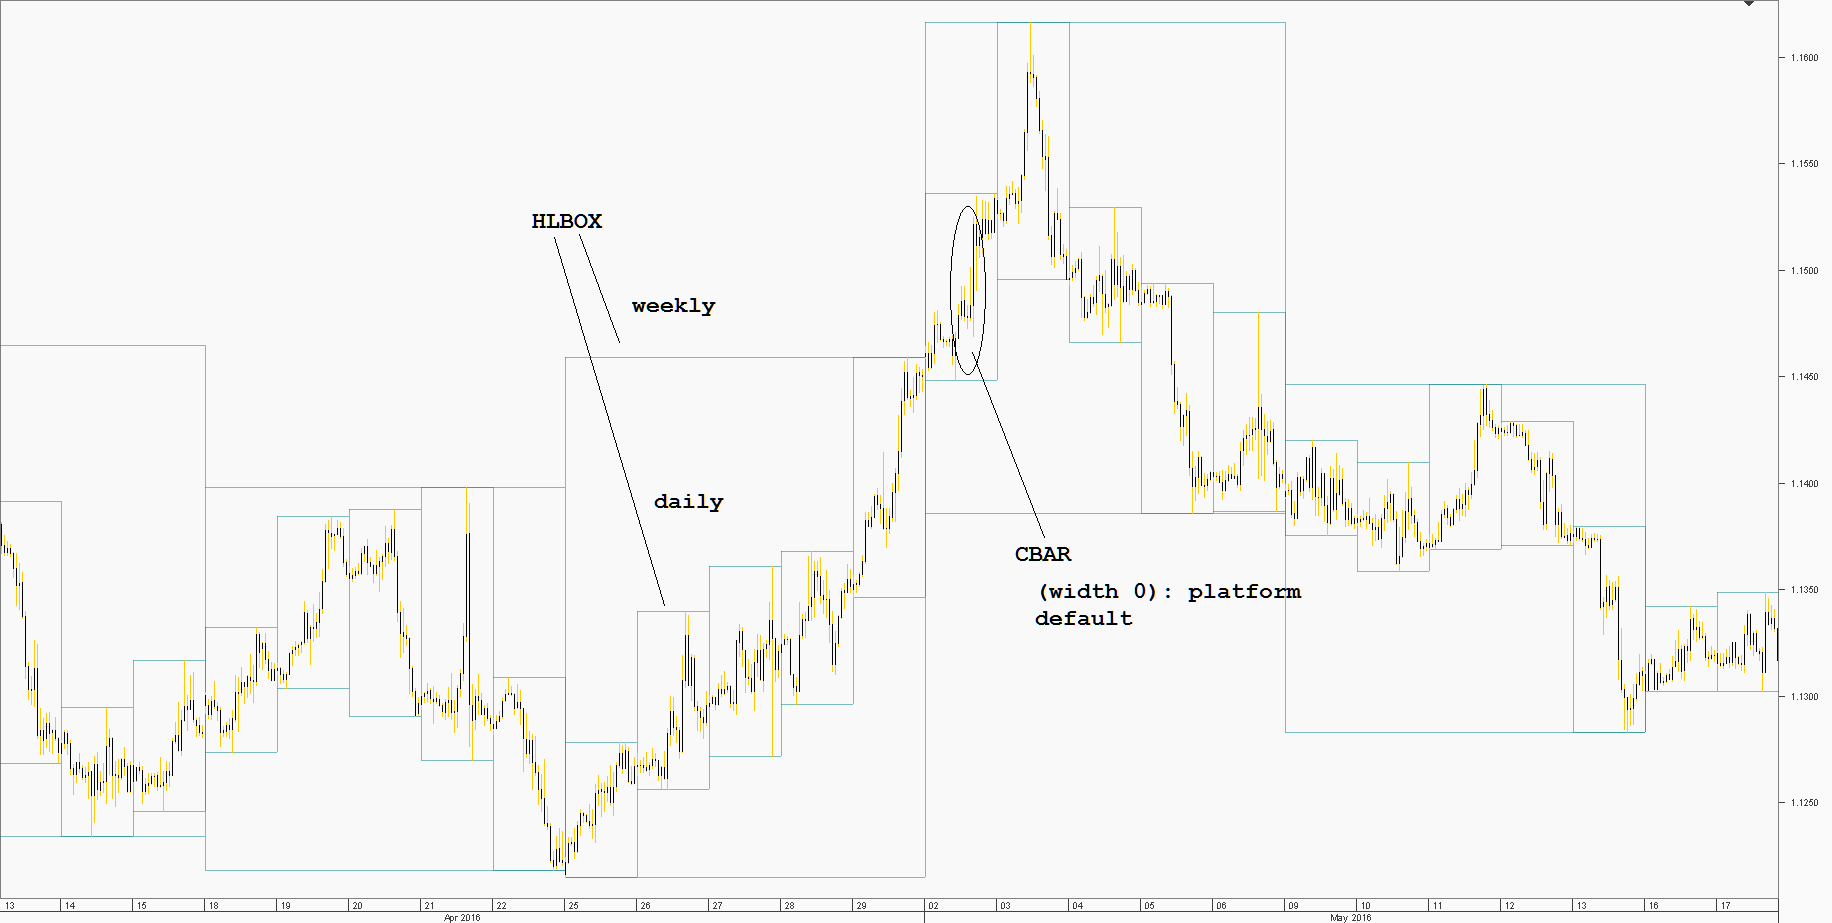
You can also select to show only periods, or highs/lows:

Image
Image

CBar(aka HLBar v3):

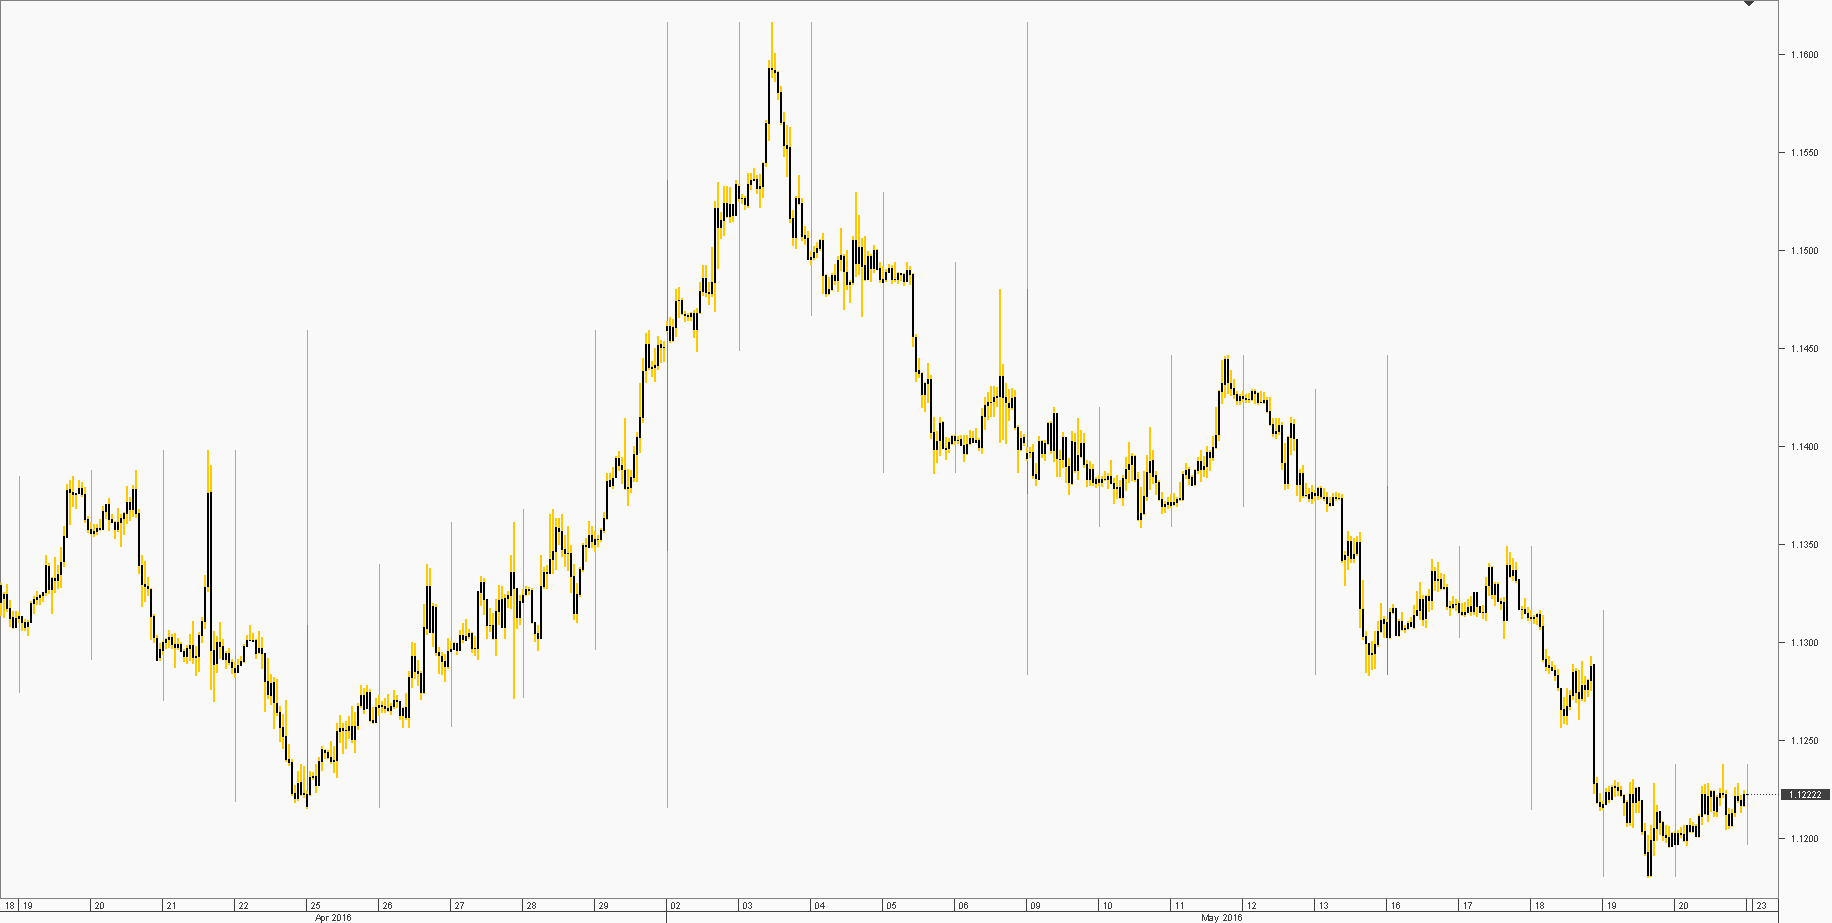
Cbar, previously known as HLBar paint customized bars/candles with many options to chose. CBar stand for "custom bar". You can make it paint OHLC(like standard candle but wicks have a same width as body), HL only(very useful for line charts, viz. LCHMA indicator below), HL peaks only(useful for line charts as well) and in this latest version you can also chose width to the point it will leave no space in between. First pic above already show CBar with default width as well, following 2 pics show width 1 and 2:

Image
Image

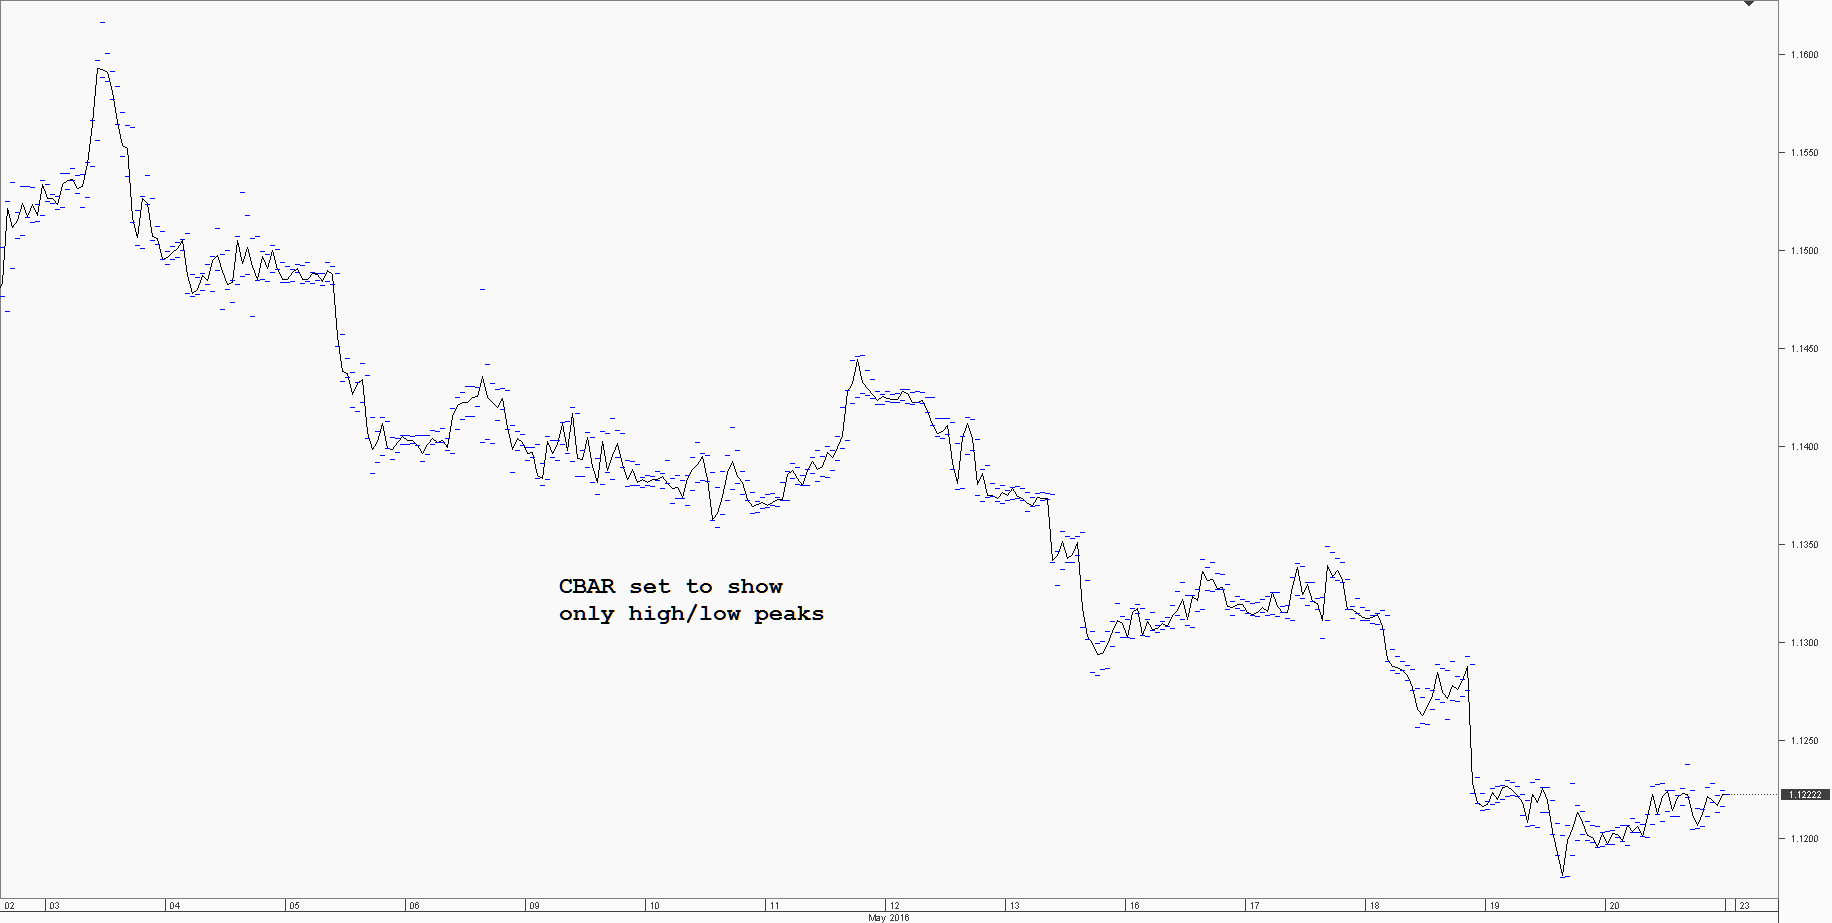
And for line chart to show only HL peaks:

Image

LCHMA:

LCHMA stands for "line chart moving average". It is exactly same as line chart, but since its an indicator it can be painted on top of other things. This is SMA with hardcoded period of 1. At the time of creating it, original Dukascopy`s SMA only support lowest period of 2, which is not same anymore. You can still achieve same with Linear Regression MA set to lowest 2, but to avoid unnecessary over-calculations I created this.
Now I show you how you can use LCHMA with combination of previous CBar indicator:

Image

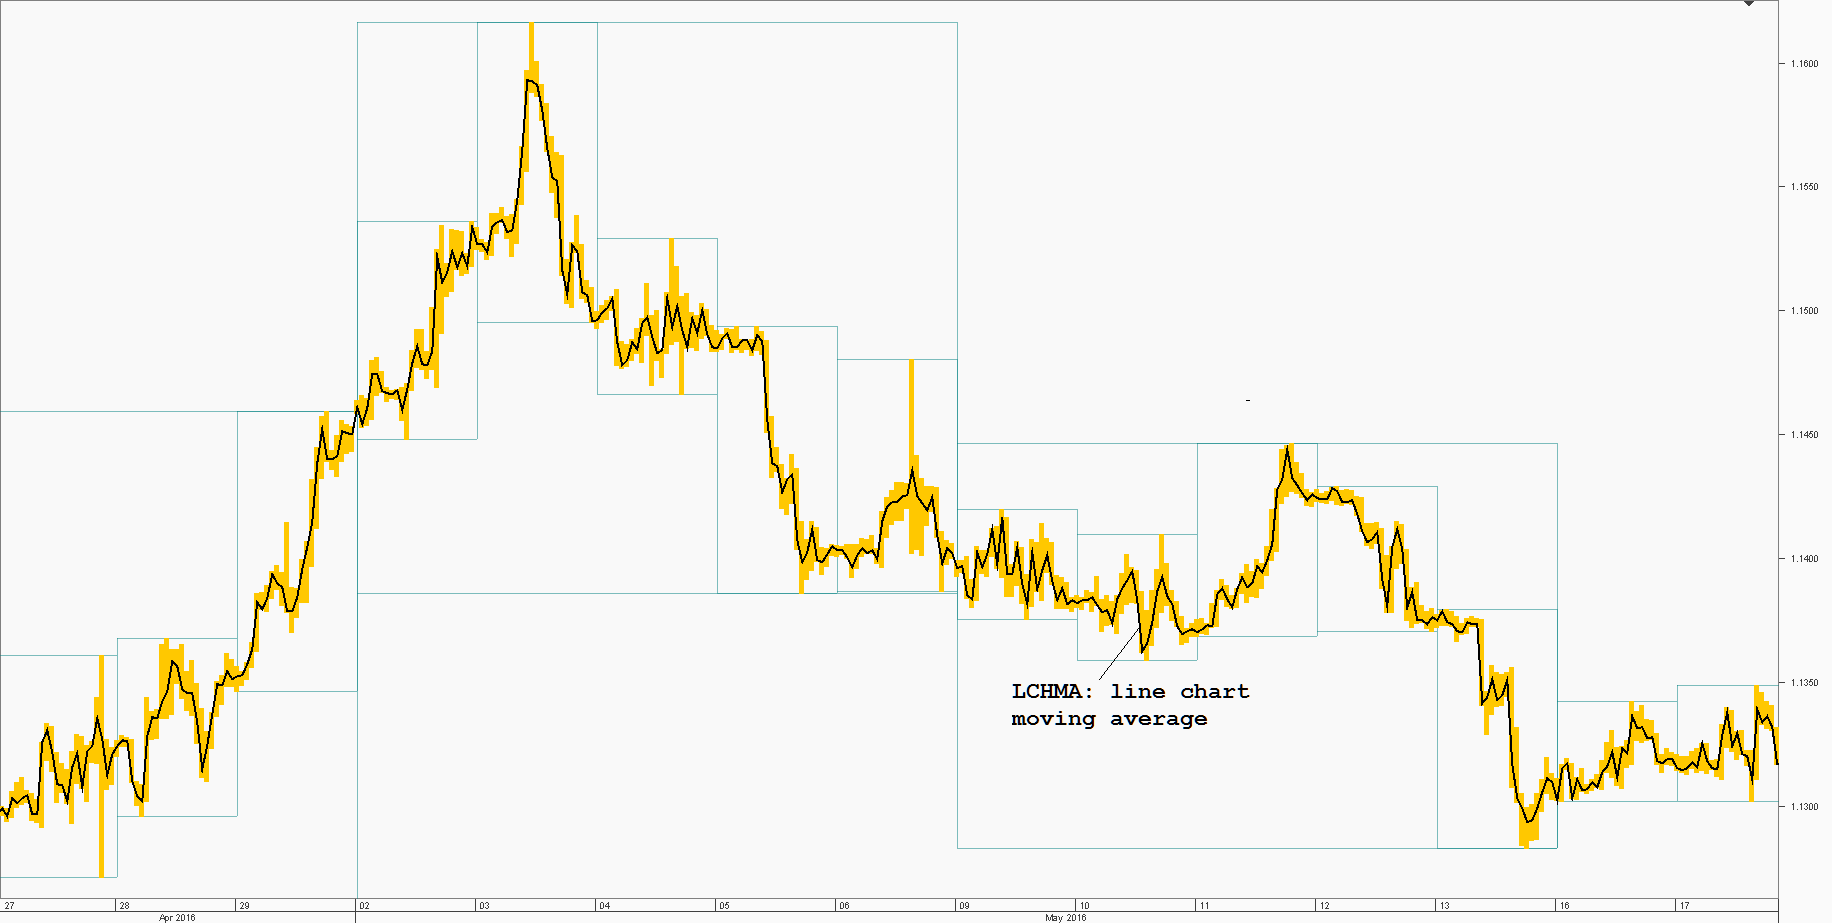
Alas, now you have a line chart and see highs and lows at the same time.

LCI:

LCI stands for "last close indicator" and paint a tiny dot on the last close period:

Image

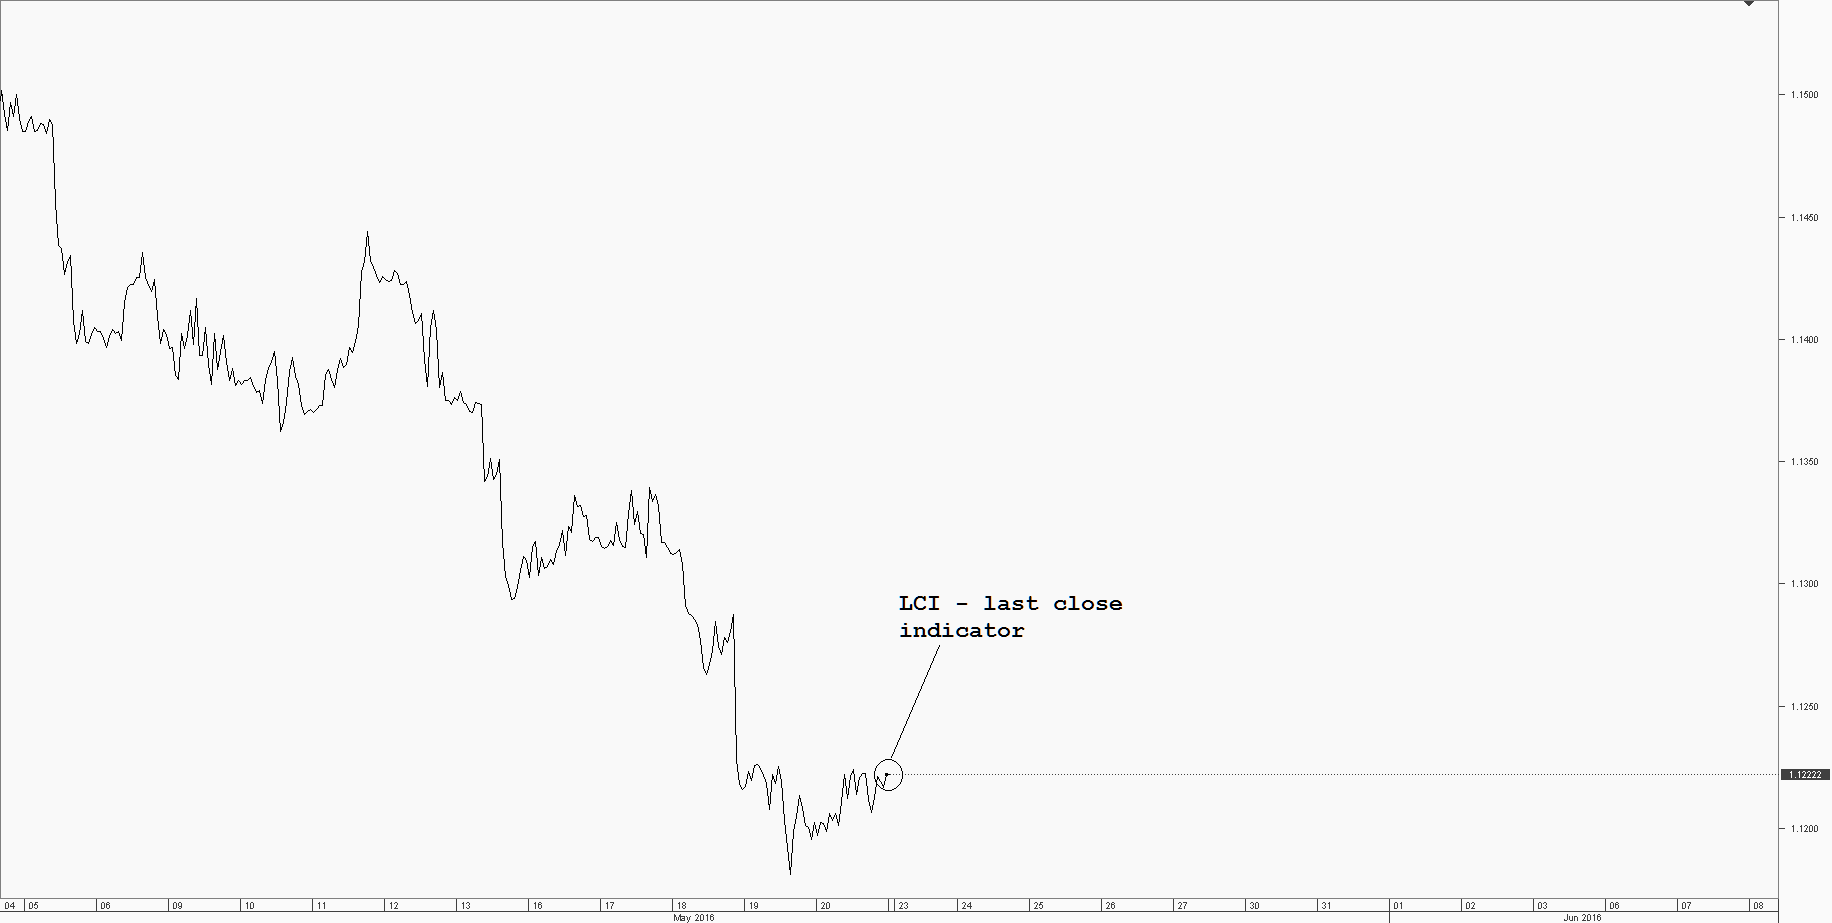
This way you know exactly where last period ended and where current volatility is, this is extremely helpful for line charts because they can repaint badly on current price movement before they close - changing whole picture.

Thats it. You can make some real beauty from these tools, following 2 pics are for your inspiration:

Image
Image

Hope these tools help you, bye ^_`.


Attachments:
Chart_EUR_USD_Hourly_snapshot1.png [35.24 KiB]
Downloaded 723 times
Chart_EUR_USD_Hourly_snapshot7.png [28.35 KiB]
Downloaded 770 times
Chart_EUR_USD_Hourly_snapshot8.png [23.81 KiB]
Downloaded 789 times
Chart_EUR_USD_Hourly_snapshot2.png [29.47 KiB]
Downloaded 754 times
Chart_EUR_USD_Hourly_snapshot3.png [31.25 KiB]
Downloaded 739 times
Chart_EUR_USD_Hourly_snapshot4.png [25.99 KiB]
Downloaded 716 times
Chart_EUR_USD_Hourly_snapshot5.png [29.43 KiB]
Downloaded 770 times
Chart_EUR_USD_Hourly_snapshot6.png [17.31 KiB]
Downloaded 793 times
Chart_EUR_USD_Hourly_snapshot9.png [31.61 KiB]
Downloaded 770 times
Chart_EUR_USD_Hourly_snapshot99.png [28.3 KiB]
Downloaded 701 times
CBar.zip [9.84 KiB]
Downloaded 248 times
HLBoxV12.zip [27.79 KiB]
Downloaded 243 times
LCHMA.zip [5.21 KiB]
Downloaded 234 times
LCI.zip [8.3 KiB]
Downloaded 243 times
DISCLAIMER: Dukascopy Bank SA's waiver of responsability - Documents, data or information available on this webpage may be posted by third parties without Dukascopy Bank SA being obliged to make any control on their content. Anyone accessing this webpage and downloading or otherwise making use of any document, data or information found on this webpage shall do it on his/her own risks without any recourse against Dukascopy Bank SA in relation thereto or for any consequences arising to him/her or any third party from the use and/or reliance on any document, data or information found on this webpage.
 
 Post subject: Re: CBar, HLBox, LCI, LCHMA, my set of custom indicators in latest versions Post rating: 0   New post Posted: Fri 09 Dec, 2016, 21:10 
User avatar

User rating: 2
Joined: Sat 05 May, 2012, 01:28
Posts: 27
Location: IcelandIceland
With the new jForex 3 version, new possibilities arrived, beyond even my own imagination.
First of all new jForex 3 make now HLBox indicator obsolete, you can achieve same and better results with CBar only:

Image

^All you have to do is to set it to "Custom Period", such as Daily or Weekly(and dont forget to set "width" to "2" for smooth background(not the one in the output though)). Not only is this much more accurate as platform itself does all timezone hassle and frame calculation for you, it is also more convenient as a background color fill instead of drawing boxes. On top of that, if you like you can paint OC and HL in separate colors, literally painting higher timeframe "candles" inside lower TF chart. Picture above is composed of 3 CBars, one of weekly, daily and 1h custom period each, laid on each other.


Furthermore, LCHMA indicator also got another meaning in new jForex 3, again thanks to "Custom Period" option:

Image

^What you see above is a line chart of 1h, daily, weekly and monthly in *single chart* without timeframe switching! 1H is native and the rest are LCHMA's. And I mean exact line chart not moving average that is supposed to emulate higher TF line. Right now because of how new system work, to achieve proper close times you need to either set the "price" to "close" and "shift" to +1, or leave the "shift" at default "0" but set the "price" to "open". Also, LCI indicator doesnt work properly with LCHMA's at custom periods. I may look more into this in the future and recode everything, as well as for CBar I already planned to add new feature, if I ever find time.


All in all, I played with new jForex 3 for last few days and I think developers did such a fantastic job, bringing new possibilities for indicator developers on the table as well as many other things, yet at the same time kept the code compatible. I was worried if I have to recode everything for the new platform, only to find they made my indicators even better and more useful. Bravo.


Attachments:
Chart_EUR_USD_Hourly_snapshot.png [27.74 KiB]
Downloaded 582 times
Chart_USD_JPY_Hourly_snapshot.png [26.58 KiB]
Downloaded 555 times
DISCLAIMER: Dukascopy Bank SA's waiver of responsability - Documents, data or information available on this webpage may be posted by third parties without Dukascopy Bank SA being obliged to make any control on their content. Anyone accessing this webpage and downloading or otherwise making use of any document, data or information found on this webpage shall do it on his/her own risks without any recourse against Dukascopy Bank SA in relation thereto or for any consequences arising to him/her or any third party from the use and/or reliance on any document, data or information found on this webpage.
 

Jump to:  

  © 1998-2024 Dukascopy® Bank SA
On-line Currency forex trading with Swiss Forex Broker - ECN Forex Brokerage,
Managed Forex Accounts, introducing forex brokers, Currency Forex Data Feed and News
Currency Forex Trading Platform provided on-line by Dukascopy.com