|
Attention! Read the forum rules carefully before posting a topic.
Try to find an answer in Wiki before asking a question.
Submit programming questions in this forum only.
Off topics are strictly forbidden.
Any topics which do not satisfy these rules will be deleted.
| Different results using instrument in JForex client to stand-alone API |
|
tommy5d
|
| Post subject: Different results using instrument in JForex client to stand-alone API |
Post rating: 0
|
 Posted: Thu 29 Mar, 2012, 15:07
|
|
User rating: 5
Joined: Thu 29 Mar, 2012, 15:00
Posts: 19
|
|
|
|
|
 |
|
API Support
|
| Post subject: Re: Different results using instrument in JForex client to stand-alone API |
Post rating: 0
|
Posted: Fri 30 Mar, 2012, 10:51
|
|
User rating: ∞
Joined: Fri 31 Aug, 2007, 09:17
Posts: 6139
|
|
|
|
|
|
|
tommy5d
|
| Post subject: Re: Different results using instrument in JForex client to stand-alone API |
Post rating: 0
|
Posted: Mon 02 Apr, 2012, 18:14
|
|
User rating: 5
Joined: Thu 29 Mar, 2012, 15:00
Posts: 19
|
|
Thanks for the swift reply...
I've been through your instructions and learnt a reasonable amount of new stuff but I'm still unable to get to the bottom of my issue.
I've been through all of the settings and ensured they're the same across both the client and the strategy but all of my results seem to be off to some degree. The overall trend is there but it seems to fluctuate more quickly in my CSV of data than the actual OHLC informer data.
I've attached some code which can either be run standalone or through the client which adds my indicator to a chart and it works correctly but also exports a CSV of the data being manually generated from onBar... you'll be able to see for yourself that they don't match up. I'm sure though I've just messed something up in the onBar call... I'd be extremely grateful if you could tell me what it is.
Thank you again,
Tommy
| Attachments: |
 RSXDemoStrat.zip [6.75 KiB]
Downloaded 333 times
|
|
DISCLAIMER: Dukascopy Bank SA's waiver of responsability - Documents, data or information available on
this webpage may be posted by third parties without Dukascopy Bank SA being obliged to make any control
on their content. Anyone accessing this webpage and downloading or otherwise making use of any document,
data or information found on this webpage shall do it on his/her own risks without any recourse against
Dukascopy Bank SA in relation thereto or for any consequences arising to him/her or any third party from
the use and/or reliance on any document, data or information found on this webpage.
|
|
|
|
|
|
|
|
API Support
|
| Post subject: Re: Different results using instrument in JForex client to stand-alone API |
Post rating: 0
|
Posted: Tue 03 Apr, 2012, 13:45
|
|
User rating: ∞
Joined: Fri 31 Aug, 2007, 09:17
Posts: 6139
|
For us the indicator does not draw anything after the back-testing start: 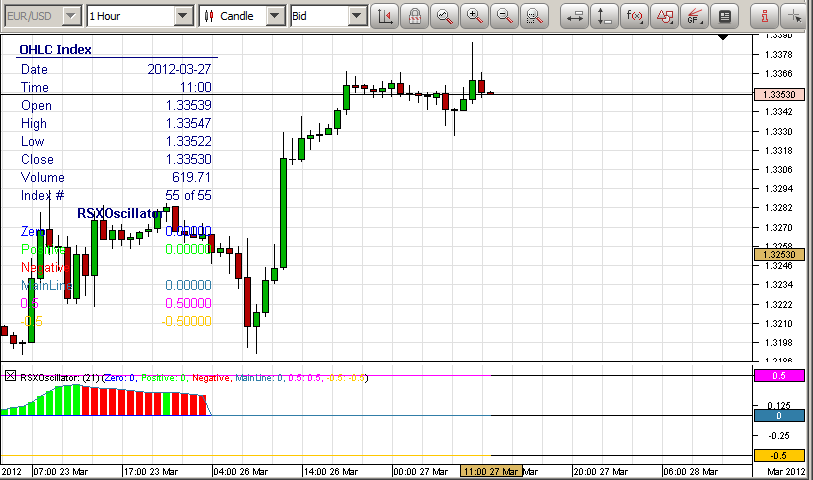
| Attachments: |
RSXOscillator.png [30.08 KiB]
Downloaded 582 times
|
|
DISCLAIMER: Dukascopy Bank SA's waiver of responsability - Documents, data or information available on
this webpage may be posted by third parties without Dukascopy Bank SA being obliged to make any control
on their content. Anyone accessing this webpage and downloading or otherwise making use of any document,
data or information found on this webpage shall do it on his/her own risks without any recourse against
Dukascopy Bank SA in relation thereto or for any consequences arising to him/her or any third party from
the use and/or reliance on any document, data or information found on this webpage.
|
|
|
|
|
|
|
|
tommy5d
|
| Post subject: Re: Different results using instrument in JForex client to stand-alone API |
Post rating: 0
|
Posted: Tue 03 Apr, 2012, 16:29
|
|
User rating: 5
Joined: Thu 29 Mar, 2012, 15:00
Posts: 19
|
Okay, thanks for trying it... My graph also seems to stop at roughly the beginning of the 26th March like yours does when back testing but it's not fair to say that it doesn't draw at all after the back-testing starts. If I do for the Last 3 months then it does all the data up until that date. I'm not sure why this is... the values being generated in my onBar in the CSV carry on all the way up to the current day and when I attach the indicator to the chart I get the indicator drawn all the way to the current day. Really, I'd be extremely happy if you could just explain to me why the data being generated from onBar and put out to the CSV is different to that drawn on the graph? The data from the graph is simply coming from the following line: chart.addIndicator(indicators.getIndicator("RSXOscillator"), new Object[] { 21 });The way I'm getting the data in the onBar method is using: Object[] rsxArray1 = this.indicators.calculateIndicator(Instrument.EURUSD, Period.ONE_HOUR, new OfferSide[] { OfferSide.BID }, "RSXOscillator",
new IIndicators.AppliedPrice[] { IIndicators.AppliedPrice.CLOSE }, new Object[] { 21 }, Filter.WEEKENDS, 21, bidBar.getTime(), 1);Is the best way to get indicator data in a strategy to do this in the onBar or is there a way of accessing the indicator data that's already on the chart? Thank you, Tommy
|
|
|
|
|
|
|
tommy5d
|
| Post subject: Re: Different results using instrument in JForex client to stand-alone API |
Post rating: 0
|
Posted: Thu 05 Apr, 2012, 10:32
|
|
User rating: 5
Joined: Thu 29 Mar, 2012, 15:00
Posts: 19
|
Sorry to be a nag but please let me know how you get on with this as it's holding me back from pushing my strategy live. I think it should be relatively easy to see the problem yourselves... simply add the chart in JForex and match the filter, etc. to that from the code below and compare it to the values that are generated from this code in the onBar method. Object[] rsxArray1 = this.indicators.calculateIndicator(Instrument.EURUSD, Period.ONE_HOUR, new OfferSide[] { OfferSide.BID }, "RSXOscillator",
new IIndicators.AppliedPrice[] { IIndicators.AppliedPrice.CLOSE }, new Object[] { 21 }, Filter.WEEKENDS, 21, bidBar.getTime(), 1);You'll see that although the overall trend is correct for some reason all the individual values are off. It also appears that the values given from the code react a lot quicker to newer price data? I'm sure the problem will simply be how I've called the custom indicator, probably in the last few parameters I've provided, i.e. the numberOfBarsBefore, time, numberOfBarsAfter. If you can't see what the problem is I'd be incredibly grateful if could you knock me up a simple strategy that uses this custom indicator properly? Thank you in advance,
|
|
|
|
|
|
|
API Support
|
| Post subject: Re: Different results using instrument in JForex client to stand-alone API |
Post rating: 0
|
Posted: Thu 05 Apr, 2012, 10:47
|
|
User rating: ∞
Joined: Fri 31 Aug, 2007, 09:17
Posts: 6139
|
|
Also when we add the indicator on chart to work with in-progress data (manually, not from strategy), it drew only zero values after the plotting time point (try with ticks or 10 second bars). Thus, you have to check why the indicator does not calculate with in-progress data in first place.
|
|
|
|
|
|
|
tommy5d
|
| Post subject: Re: Different results using instrument in JForex client to stand-alone API |
Post rating: 0
|
Posted: Thu 05 Apr, 2012, 11:53
|
|
User rating: 5
Joined: Thu 29 Mar, 2012, 15:00
Posts: 19
|
|
Oh yeah, I see your point. I took the indicator from the custom indicators thread on this forum so I assumed it worked okay! I've got the original MQ4 file around somewhere so I'll have a go at recreating it and if I struggle then I'll send you the MQ4.
Thank you.
|
|
|
|
|
|
 
|
Pages: [
1
]
|
|
|
|
|