|
Attention! Read the forum rules carefully before posting a topic.
Try to find an answer in Wiki before asking a question.
Submit programming questions in this forum only.
Off topics are strictly forbidden.
Any topics which do not satisfy these rules will be deleted.
| Problem with RayLinePriceByShift.java strategy on the Wiki |
|
nicofr0707
|
| Post subject: Problem with RayLinePriceByShift.java strategy on the Wiki |
Post rating: 0
|
 Posted: Thu 15 Mar, 2012, 00:17
|
|
User rating: 5
Joined: Fri 02 Sep, 2011, 10:08
Posts: 157
Location: FranceFrance
|
Hi, My strategy is alerting me when the price hits a trendline. But often signals aren't accurate, I have scratched my head of until I have tested the strategy from the wiki on which I have based my code on : RayLinePriceByShift.java ( https://www.dukascopy.com/wiki/#Ray_line_prices_by_shift) On small timeframes markers are at the right position, if you go higher than 15 minutes it starts to become a mess. Please see the following comparison :   Please could you help me, I really don't know how to fix this because the trigo calculations seem ok. Maybe some chart rounding problems on higher timeframes to workaround ? Some other thing I have noticed, in onBar() it seems Period.TEN_SECONDS isn't triggered anymore if no chart shows a 10 sec chart (Tried on the last API+demo). Problematic, since I have to do calculations every 10sec. Try this in onBar(), you will see that nothing happens : if (instrument != Instrument.EURUSD || period != Period.TEN_SECS) {
return;
}
Print(period);Thank you in advance for the help.
|
|
|
|
|
 |
|
API Support
|
| Post subject: Re: Problem with RayLinePriceByShift.java strategy on the Wiki |
Post rating: 0
|
Posted: Thu 15 Mar, 2012, 09:30
|
|
User rating: ∞
Joined: Fri 31 Aug, 2007, 09:17
Posts: 6139
|
nicofr0707 wrote: My strategy is alerting me when the price hits a trendline. But often signals aren't accurate, I have scratched my head of until I have tested the strategy from the wiki on which I have based my code on : RayLinePriceByShift.java ( https://www.dukascopy.com/wiki/#Ray_line_prices_by_shift) On small timeframes markers are at the right position, if you go higher than 15 minutes it starts to become a mess. Please see the following comparison : (..) Please could you help me, I really don't know how to fix this because the trigo calculations seem ok. Maybe some chart rounding problems on higher timeframes to workaround ? We tried in Historical Tester the RayLinePriceByShift strategy with different periods from 1 min to 1 hour and we could not replicate the issue. Could you please provide a more precise case? nicofr0707 wrote: Some other thing I have noticed, in onBar() it seems Period.TEN_SECONDS isn't triggered anymore if no chart shows a 10 sec chart (Tried on the last API+demo). Problematic, since I have to do calculations every 10sec. Try this in onBar(), you will see that nothing happens : if (instrument != Instrument.EURUSD || period != Period.TEN_SECS) {
return;
}
Print(period); We could not replicate this - all 10 sec bars got printed by using the following onBar method: public void onBar(Instrument instrument, Period period, IBar askBar, IBar bidBar) throws JFException {
print(instrument + " " +period + " bar " + askBar);
}
|
|
|
|
|
|
|
nicofr0707
|
| Post subject: Re: Problem with RayLinePriceByShift.java strategy on the Wiki |
Post rating: 0
|
Posted: Thu 15 Mar, 2012, 10:30
|
|
User rating: 5
Joined: Fri 02 Sep, 2011, 10:08
Posts: 157
Location: FranceFrance
|
Thanks for the response. Quote: We tried in Historical Tester the RayLinePriceByShift strategy with different periods from 1 min to 1 hour and we could not replicate the issue. Could you please provide a more precise case? I did the following with the tester : Frist remove the chart.removeAll(); in onstop() so we can see the result. 1 - Launch the strategy in the tester for the last day. 2 - Pause the strategy 3 - Switch to 1hour chart 4 - Drag the ray line on the top of the big swings (see where are the two points on the following screenshot) 5 - Unpause the tester and let it run to the end Here is the result I have from the last JForex demo version :  Quote: We could not replicate this - all 10 sec bars got printed by using the following onBar method: Curious, it works again today. Maybe I just had to reboot. Thanks
|
|
|
|
|
|
|
API Support
|
| Post subject: Re: Problem with RayLinePriceByShift.java strategy on the Wiki |
Post rating: 0
|
Posted: Thu 15 Mar, 2012, 14:05
|
|
User rating: ∞
Joined: Fri 31 Aug, 2007, 09:17
Posts: 6139
|
nicofr0707 wrote: I did the following with the tester :
Frist remove the chart.removeAll(); in onstop() so we can see the result.
1 - Launch the strategy in the tester for the last day.
2 - Pause the strategy
3 - Switch to 1hour chart
4 - Drag the ray line on the top of the big swings (see where are the two points on the following screenshot)
5 - Unpause the tester and let it run to the end We managed to replicate this. The values (i,e. price markers) indeed are correct, but the deviation is caused by the fact that the minimum time axis increment is 1 bar, therefore, for example, on 1 min chart 09:17:00 point will get plotted on 09:17:00 bar, but on 1 hour chart - on 10:00:00 bar. This should fix the visual representation (mind that the price marker values won't be correct from geometrical standpoint): long timePivot = history.getBarStart(chart.getSelectedPeriod(), rayLine.getTime(0));
long timeHandle = history.getBarStart(chart.getSelectedPeriod(),rayLine.getTime(1));
|
|
|
|
|
|
|
nicofr0707
|
| Post subject: Re: Problem with RayLinePriceByShift.java strategy on the Wiki |
Post rating: 0
|
Posted: Thu 15 Mar, 2012, 16:25
|
|
User rating: 5
Joined: Fri 02 Sep, 2011, 10:08
Posts: 157
Location: FranceFrance
|
|
Hello thanks.
I tried your solution, but unfortunately it draws exactly the same thing...
|
|
|
|
|
|
|
API Support
|
| Post subject: Re: Problem with RayLinePriceByShift.java strategy on the Wiki |
Post rating: 0
|
Posted: Fri 16 Mar, 2012, 09:56
|
|
User rating: ∞
Joined: Fri 31 Aug, 2007, 09:17
Posts: 6139
|
Please try the full version: Attachment:
 RayLinePriceByShift2.java [6.18 KiB]
Downloaded 422 times
RayLinePriceByShift2.java [6.18 KiB]
Downloaded 422 times
In either case, if after the period change you also move both of the line points (this makes the drawn and actual time coordinates to match), then the price markers should get drawn on the line.
|
|
|
|
|
|
|
nicofr0707
|
| Post subject: Re: Problem with RayLinePriceByShift.java strategy on the Wiki |
Post rating: 0
|
Posted: Fri 16 Mar, 2012, 17:02
|
|
User rating: 5
Joined: Fri 02 Sep, 2011, 10:08
Posts: 157
Location: FranceFrance
|
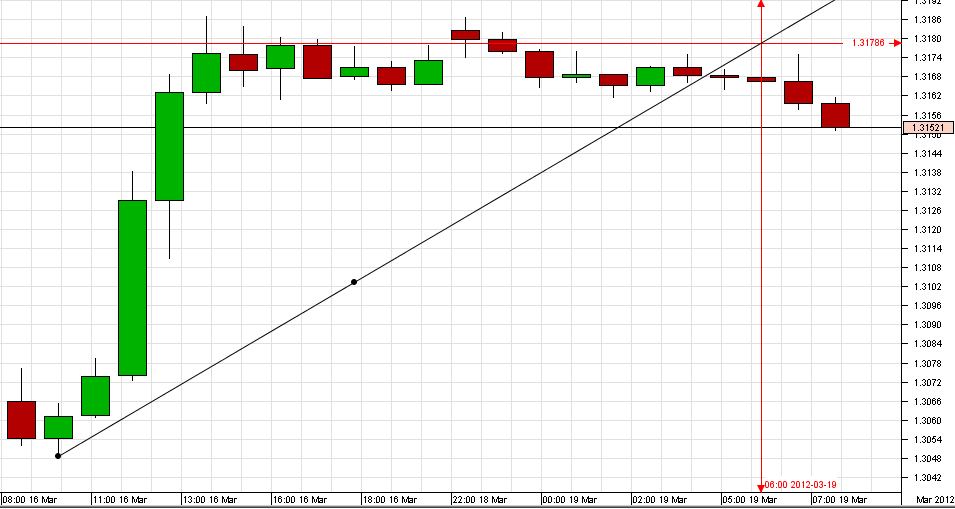
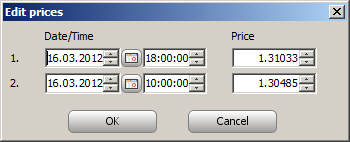
Sorry, I took your last strategy as it is. Have done the procedure described at the beginning of the post and still exactly the same issue. BUT maybe I have found from where the problem comes, but I have no idea how to workaround this. Try tracing a Rayline on the 1hour period on a meaningful price top, then switch to lower periods. You will see that the line shifts significantly when you reach <1min periods. I have tested this on MT4 with the EXACT same settings NO shift at all, the trendline is ALWAYS at it's place whatever timeframe you use. Please see the following screenshot that describes the test :  Moreover, I found out that the strategy you have provided is following to the pip that "false" 1min Rayline no matter in which timeframe you are. This explains the pricemarkers shift in timeframes > 1min. Maybe it is a bug in the platform, but I can't afford to wait any longer for this to being fixed. Could you please provide me with a strategy that replicates the platforms trendline behaviors so it returns the price like it is on my screen. (I don't draw on the 1H chart to trade on the 1min so this issue is not as bad for me) Thanks, have a good week end
|
|
|
|
|
|
|
nicofr0707
|
| Post subject: Re: Problem with RayLinePriceByShift.java strategy on the Wiki |
Post rating: 0
|
Posted: Mon 19 Mar, 2012, 06:41
|
|
User rating: 5
Joined: Fri 02 Sep, 2011, 10:08
Posts: 157
Location: FranceFrance
|
I had the idea as I was sleeping ! This does not resolve the previous posts 28pip bar shift to the upside but explains the price markers aren't in line with the rayline. You have to disable w-e end flat filter in JForex ! Please see the screenshot... now the markers and the rayline are at the right place. Could you please provide us with a new java file that takes into account which Flat Filtration and Sunday Daily candles filtration has been selected in the ide and takes the right trigo calculations for the price markers to be placed accordingly.  Thanks PS : Your may register my previous post as a JForex bug.
|
|
|
|
|
|
|
API Support
|
| Post subject: Re: Problem with RayLinePriceByShift.java strategy on the Wiki |
Post rating: 0
|
Posted: Mon 19 Mar, 2012, 09:42
|
|
User rating: ∞
Joined: Fri 31 Aug, 2007, 09:17
Posts: 6139
|
nicofr0707 wrote: PS : Your may register my previous post as a JForex bug. As far as we tested - there is no problem if the ray line pivot points have the same coordinates as the displayed, i.e., rounded ones, regardless of applied filters. We did the following - plotted on the chart a ray line and two helper lines such that: - Both pivot points are before the weekend filter.
- The pivot points have round 1 hour time values (see the next image).
- Helper lines and the ray line cross in the same point after the weened filters.
  Then we changed the timeframe to 10 minutes and we see that the three lines still cross in the same point: 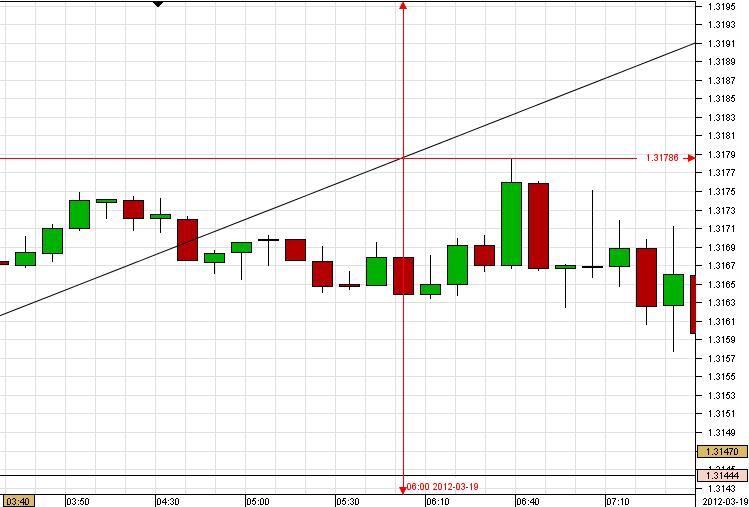 nicofr0707 wrote: Could you please provide us with a new java file that takes into account which Flat Filtration and
Sunday Daily candles filtration has been selected in the ide and takes the right trigo calculations for the price
markers to be placed accordingly. As you see the problem is still not with the filters but presumably with the time rounding. If you really want to make sure that the visual values match the strategy ones, then consider in onTick checking the timeframe and then applying the rounded time values to the ray line, i.e.: rayLine.setTime(0, history.getBarStart(chart.getSelectedPeriod(), rayLine.getTime(0)));
rayLine.setTime(1, history.getBarStart(chart.getSelectedPeriod(), rayLine.getTime(1)));
| Attachments: |
ray3.png [26.42 KiB]
Downloaded 743 times
|
ray2.png [32.52 KiB]
Downloaded 699 times
|
ray1.png [6.63 KiB]
Downloaded 695 times
|
|
DISCLAIMER: Dukascopy Bank SA's waiver of responsability - Documents, data or information available on
this webpage may be posted by third parties without Dukascopy Bank SA being obliged to make any control
on their content. Anyone accessing this webpage and downloading or otherwise making use of any document,
data or information found on this webpage shall do it on his/her own risks without any recourse against
Dukascopy Bank SA in relation thereto or for any consequences arising to him/her or any third party from
the use and/or reliance on any document, data or information found on this webpage.
|
|
|
|
|
|
|
|
nicofr0707
|
| Post subject: Re: Problem with RayLinePriceByShift.java strategy on the Wiki |
Post rating: 0
|
Posted: Mon 19 Mar, 2012, 10:43
|
|
User rating: 5
Joined: Fri 02 Sep, 2011, 10:08
Posts: 157
Location: FranceFrance
|
Hello, First, Quote: As far as we tested - there is no problem if the ray line pivot points have the same coordinates as the displayed, i.e., rounded ones, regardless of applied filters.
We did the following - plotted on the chart a ray line and two helper lines such that:
Both pivot points are before the weekend filter.
The pivot points have round 1 hour time values (see the next image).
Helper lines and the ray line cross in the same point after the weened filters. The most complicated in those issues is to create the right environment to see it happen. I propose you to reproduce the following screen then : 1 - On the 1H drag the chart so that the right side of the chart passes through the next 1h candle after the 22:00 2012-03-18 marker 2- Switch to the 1min, boom... where's the rayline ? 30 pips at the upside.  Second, Quote: As you see the problem is still not with the filters but presumably with the time rounding. If you really want to make sure that the visual values match the strategy ones, then consider in onTick checking the timeframe and then applying the rounded time values to the ray line, i.e.: That rounding issue isn't that relevant to trigger such a shift in the markers, I've tried it. I'm pretty sure the problem comes from the filters because it makes a substantial move in the rayline angle and influences the trigo calculations : // This is true only if filters are disabled
double timeDelta = timePivot - timeHandle;
// If there are week-ends, you have to take into account the time gaps in the charts
double timeDelta = timePivot - timeHandle - weekEndDurationBetweenPoints;
How do we know which filter has been enabled ? I can do it myself, but I assume you have to update the wiki so I prefer to take your solution if you want to write one. Let me know... I hope all these infos help. Best regards
|
|
|
|
|
|
|
API Support
|
| Post subject: Re: Problem with RayLinePriceByShift.java strategy on the Wiki |
Post rating: 0
|
Posted: Mon 19 Mar, 2012, 14:21
|
|
User rating: ∞
Joined: Fri 31 Aug, 2007, 09:17
Posts: 6139
|
We managed to replicate the issue - in our case both ray line points were on the same trading week - in yours they were on different ones and that made the difference. nicofr0707 wrote: How do we know which filter has been enabled ? Currently this is not available from API, since this is a JForex client preferences setting. nicofr0707 wrote: I can do it myself, but I assume you have to update the wiki so I prefer to take your solution
if you want to write one. Let me know... We reiterate that such value adjustments result in wrong values from mathematical standpoint, which may not be acceptable for other users. Also such changes would further sophisticate the example. We added notes to the example for the users to take into consideration the possible visualization problems when changing time frames and when having pivot and handle points are on different trading weeks.
|
|
|
|
|
|
|
nicofr0707
|
| Post subject: Re: Problem with RayLinePriceByShift.java strategy on the Wiki |
Post rating: 0
|
Posted: Mon 19 Mar, 2012, 15:06
|
|
User rating: 5
Joined: Fri 02 Sep, 2011, 10:08
Posts: 157
Location: FranceFrance
|
Quote: We managed to replicate the issue - in our case both ray line points were on the same trading week - in yours they were on different ones and that made the difference. OK. Quote: We reiterate that such value adjustments result in wrong values from mathematical standpoint, which may not be acceptable for other users. Also such changes would further sophisticate the example. We added notes to the example for the users to take into consideration the possible visualization problems when changing time frames and when having pivot and handle points are on different trading weeks.
Actually, I've done a workaround by taking only Bars instead of Time. This is totally accurate from a "Mathematical" standpoint and avoids the weekends and flat bars issue. What you have is what you get on the screen no matter what timeframe, filter or trading week you're working with. You should take a look at the following code, it does the job at 100% and isn't much complicated. Using getBars for this is a little bit heavy, Isn't getBar() available with Filters yet ? private double getPriceByShiftBar(IRayLineChartObject rayLine, long _currentTime) throws JFException {
double result = 0;
// 2 coordinates of the ray line
double timePivot = history.getBarStart(chart.getSelectedPeriod(), rayLine.getTime(0));
double pricePivot = rayLine.getPrice(0);
double timeHandle = history.getBarStart(chart.getSelectedPeriod(),rayLine.getTime(1));
double priceHandle = rayLine.getPrice(1);
long currentTime = history.getBarStart(chart.getSelectedPeriod(), _currentTime);
// Doing the calculation not with the time, but with bars to avoid week-end time gaps issues
List<IBar> currentBarToPivot = history.getBars(chart.getInstrument(), chart.getSelectedPeriod(), chart.getSelectedOfferSide(), Filter.WEEKENDS,(long)timePivot, (long)currentTime);
List<IBar> currentBarToHandle = history.getBars(chart.getInstrument(), chart.getSelectedPeriod(), chart.getSelectedOfferSide(), Filter.WEEKENDS,(long)timeHandle, (long)currentTime);
int nbBarsToPivot = -currentBarToPivot.size();
int nbBarsToHandle = -currentBarToHandle.size();
print("nbBarsToPivot : "+nbBarsToPivot);
print("nbBarsToHandle : "+nbBarsToHandle);
print(String.format("timePivot=%s, pricePivot=%s, timeHandle=%s, priceHandle=%s",
sdf.format(timePivot), pricePivot, sdf.format(timeHandle), priceHandle));
double a = (pricePivot - priceHandle) / (nbBarsToPivot-nbBarsToHandle);
double b = priceHandle - a * nbBarsToHandle;
result = b;
return result;
}
Thanks for you're kindness.
|
|
|
|
|
|
|
API Support
|
| Post subject: Re: Problem with RayLinePriceByShift.java strategy on the Wiki |
Post rating: 0
|
Posted: Tue 20 Mar, 2012, 18:09
|
|
User rating: ∞
Joined: Fri 31 Aug, 2007, 09:17
Posts: 6139
|
nicofr0707 wrote: Using getBars for this is a little bit heavy You can consider using historical bar retrieval by candle interval and setting the candle count to 1, i.e.: https://www.dukascopy.com/wiki/#History_bars/Bars_by_candle_intervalnicofr0707 wrote: Isn't getBar() available with Filters yet ? Not in the current implementation. nicofr0707 wrote: Actually, I've done a workaround by taking only Bars instead of Time. This is totally accurate from a "Mathematical" standpoint and avoids the weekends
and flat bars issue. What you have is what you get on the screen no matter what timeframe, filter or trading week you're working with. Your approach actually simplifies the calculations, after some testing we plan to update the wiki example with a similar approach.
|
|
|
|
|
|
|
nicofr0707
|
| Post subject: Re: Problem with RayLinePriceByShift.java strategy on the Wiki |
Post rating: 0
|
Posted: Wed 21 Mar, 2012, 09:23
|
|
User rating: 5
Joined: Fri 02 Sep, 2011, 10:08
Posts: 157
Location: FranceFrance
|
Hello, Quote: You can consider using historical bar retrieval by candle interval and setting the candle count to 1, i.e.: https://www.dukascopy.com/wiki/#History_ ... e_intervalYes that's what I've intended to do. Quote: Your approach actually simplifies the calculations, after some testing we plan to update the wiki example with a similar approach.
I'm glad it could help.
|
|
|
|
|
|
|
nicofr0707
|
| Post subject: Re: Problem with RayLinePriceByShift.java strategy on the Wiki |
Post rating: 0
|
Posted: Wed 21 Mar, 2012, 10:00
|
|
User rating: 5
Joined: Fri 02 Sep, 2011, 10:08
Posts: 157
Location: FranceFrance
|
|
Please tell me when the wiki is updated so I can have look on how you did optimize this.
Thanks
|
|
|
|
|
|
|
API Support
|
| Post subject: Re: Problem with RayLinePriceByShift.java strategy on the Wiki |
Post rating: 0
|
Posted: Wed 21 Mar, 2012, 14:22
|
|
User rating: ∞
Joined: Fri 31 Aug, 2007, 09:17
Posts: 6139
|
|
|
|
|
|
|
nicofr0707
|
| Post subject: Re: Problem with RayLinePriceByShift.java strategy on the Wiki |
Post rating: 0
|
Posted: Wed 21 Mar, 2012, 16:56
|
|
User rating: 5
Joined: Fri 02 Sep, 2011, 10:08
Posts: 157
Location: FranceFrance
|
Quote: no ray line time point could be in future
Yes of course. I use a listener to avoid the user to drag the line in the future... Quote: the pivot point had to be time wise after the handle point
yes my example wasn't complete. I opened your file. private int getFilteredBarCount(long from, long to) throws JFException{
List<IBar> barsWithFilter = getChartBars(chartFilter, from, to);
List<IBar> barsWithoutFilter = getChartBars(Filter.NO_FILTER, from, to);
return barsWithoutFilter.size() - barsWithFilter.size();
}
This could overload the system if you draw a line on the daily chart and then switch to the 10sec When I have more time I will consider using your previous proposal : Quote: You can consider using historical bar retrieval by candle interval and setting the candle count to 1, i.e.: Best regards
|
|
|
|
|
|
|
API Support
|
| Post subject: Re: Problem with RayLinePriceByShift.java strategy on the Wiki |
Post rating: 0
|
Posted: Thu 22 Mar, 2012, 13:08
|
|
User rating: ∞
Joined: Fri 31 Aug, 2007, 09:17
Posts: 6139
|
nicofr0707 wrote: This could overload the system if you draw a line on the daily chart and then switch to the 10sec In that case consider loading bars asynchronously and fetching only the loaded bar count (i.e. numberOfBarsLoaded parameter): https://www.dukascopy.com/wiki/#History_ ... us_methodsNote that you will need to block the strategy execution until the loading has been finished.
|
|
|
|
|
|
 
|
Pages: [
1
]
|
|
|
|
|