Hi.
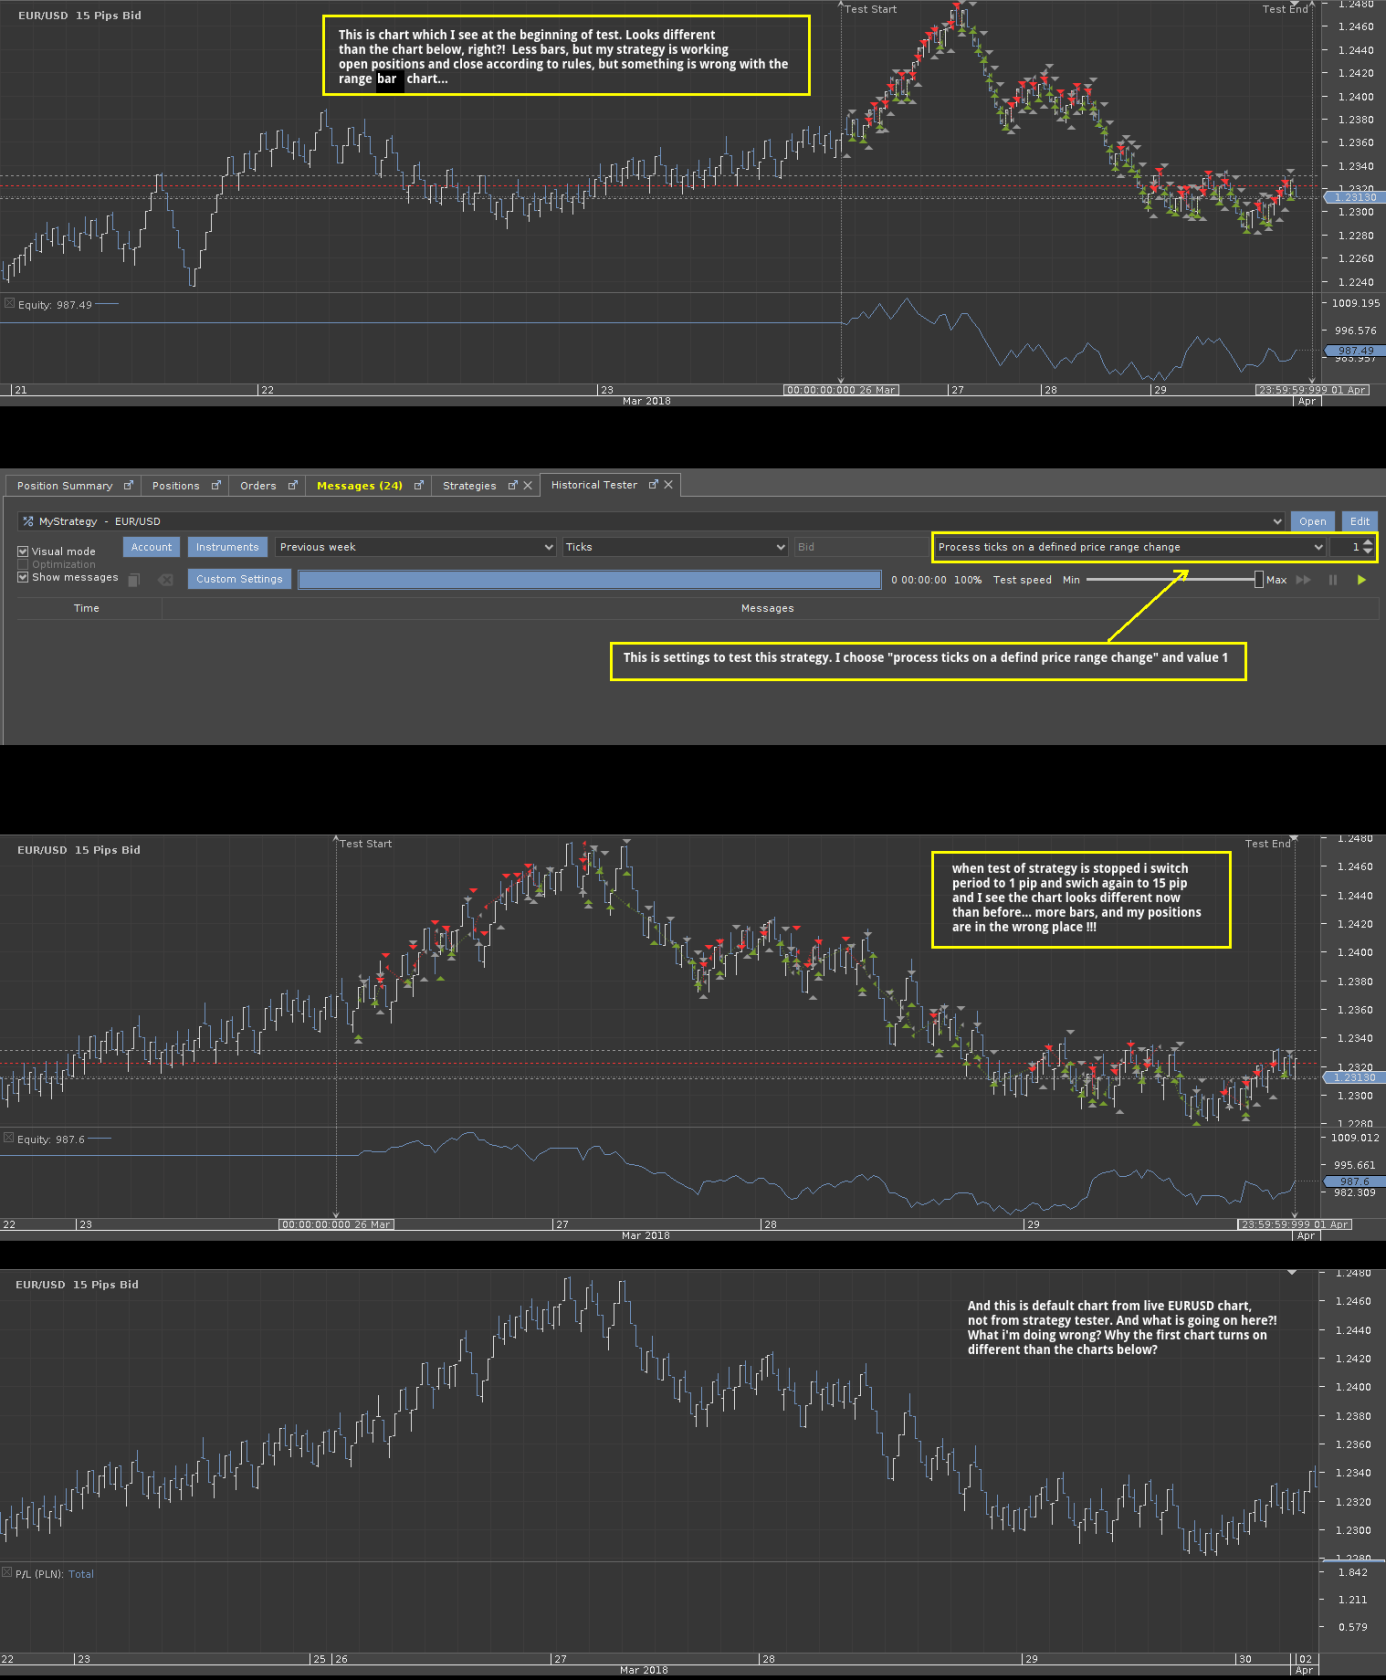
I have a problem with test my strategy, this is range bar strategy. In here is description of my problem https://images84.fotosik.pl/1035/e93aa69b73d4742f.png
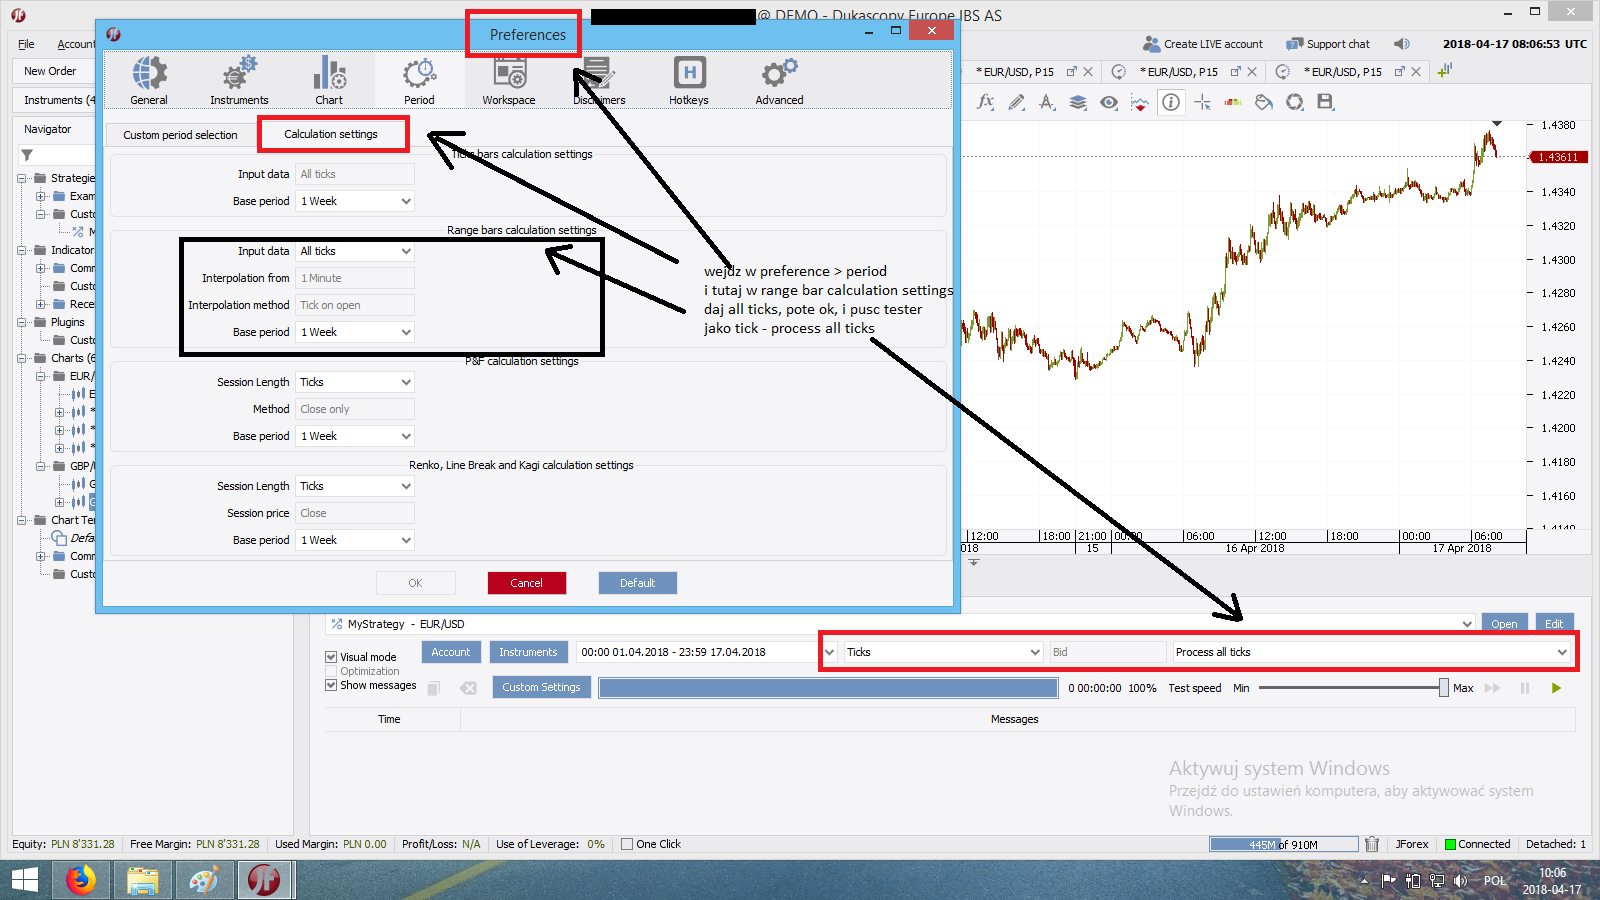
I turn on this strategy in mode "process ticks on a defined price range change" and value 1. My PriceRange in strategy is 15. I want the strategy to work on 15 pips range bars. And I don't know what i'm doing wrong. When strategy is strarted I see different chart than the live chart EURUSD is. When strategy is stopped i switch for a while to 1 pip period, and switch again to 15 pip period and then I see right chart, correct range bar chart. But at the beginning bars are different and i don't know how to change this to correct bars like from EURUSD 15 pip bar chart we see right now in that time period. So, what is wrong? This is my strategy.
Regards.
package jforex;

import java.util.*;

import com.dukascopy.api.*;
import com.dukascopy.api.IEngine.OrderCommand;
import com.dukascopy.api.IIndicators.AppliedPrice;

import com.dukascopy.api.feed.*;
import com.dukascopy.api.feed.IFeedDescriptor;
import com.dukascopy.api.feed.IFeedListener;
import com.dukascopy.api.feed.util.*;

public class MyStrategy implements IStrategy, IFeedListener {
    private IEngine engine;
    private IConsole console;
    private IHistory history;
    private IContext context;
    private IIndicators indicators;
    private IUserInterface userInterface;
    private IChart chart;
    private IOrder order;

    public double amount = 0.001;
    public double slippage = 1;

    public IFeedDescriptor feedDescriptor = new RangeBarFeedDescriptor(Instrument.EURUSD, PriceRange.valueOf(15), OfferSide.BID);

    private int counter = 0; // getLabel function global variable

    public void onStart(IContext context) throws JFException {
        this.engine = context.getEngine();
        this.console = context.getConsole();
        this.history = context.getHistory();
        this.context = context;
        this.indicators = context.getIndicators();
        this.userInterface = context.getUserInterface();
        this.chart = context.getChart(feedDescriptor.getInstrument());
        //chart.setDataPresentationType(DataType.DataPresentationType.RANGE_BAR.valueOf("ONE_PIP"));

        context.setSubscribedInstruments(java.util.Collections.singleton(feedDescriptor.getInstrument()), true);
        context.subscribeToFeed(feedDescriptor, this);
    }

    @Override
    public void onFeedData(IFeedDescriptor feedDescriptor, ITimedData feedData) {

        IRangeBar rangeBar = (IRangeBar)feedData;

        try {
            createOrder(feedDescriptor, feedData, rangeBar);
        } catch (Exception e) {
            e.printStackTrace();
        }

    }

    public void createOrder(IFeedDescriptor feedDescriptor, ITimedData feedData, IRangeBar rangeBar) throws JFException {

        double stopLossPrice, takeProfitPrice;

        if (rangeBar.getClose() > rangeBar.getOpen()) {
            // bull bar
            //print( "bull" );
            stopLossPrice = history.getLastTick(feedDescriptor.getInstrument()).getBid() + feedDescriptor.getInstrument().getPipValue() * 10;
            takeProfitPrice = history.getLastTick(feedDescriptor.getInstrument()).getBid() - feedDescriptor.getInstrument().getPipValue() * 10;
            double price = history.getLastTick(feedDescriptor.getInstrument()).getBid() + feedDescriptor.getInstrument().getPipValue() * 1;
            order = engine.submitOrder(getLabel(feedDescriptor.getInstrument()), Instrument.EURUSD, OrderCommand.SELLLIMIT, amount, price, slippage, stopLossPrice, takeProfitPrice);
            orderClose("sell");
        } else if (rangeBar.getClose() < rangeBar.getOpen()) {
            // bear bar
            // print( "bear" );
            stopLossPrice = history.getLastTick(feedDescriptor.getInstrument()).getAsk() - feedDescriptor.getInstrument().getPipValue() * 10;
            takeProfitPrice = history.getLastTick(feedDescriptor.getInstrument()).getAsk() + feedDescriptor.getInstrument().getPipValue() * 10;
            double price = history.getLastTick(feedDescriptor.getInstrument()).getAsk() + feedDescriptor.getInstrument().getPipValue() * 1;
            order = engine.submitOrder(getLabel(feedDescriptor.getInstrument()), Instrument.EURUSD, OrderCommand.BUYLIMIT, amount, price, slippage, stopLossPrice, takeProfitPrice);
            orderClose("buy");
        }

    }

    private void orderClose(String str) throws JFException {
        for (IOrder order : engine.getOrders()) {
            if (str == "buy") {
                if (order.getState() == IOrder.State.OPENED) {
                    //print( order.getId() + " " + order.getState() );
                    order.close();
                }
            } else if (str == "sell") {
                if (order.getState() == IOrder.State.OPENED) {
                    //print( order.getId() + " " + order.getState() );
                    order.close();
                }
            }
        }
    }

    public void onAccount(IAccount account) throws JFException {}

    public void onMessage(IMessage message) throws JFException {}

    public void onStop() throws JFException {}

    public void onTick(Instrument instrument, ITick tick) throws JFException {}

    public void onBar(Instrument instrument, Period period, IBar askBar, IBar bidBar) throws JFException {}

    protected String getLabel(Instrument instrument) {
        String label = instrument.name();
        label = label + (counter ++);
        label = label.toUpperCase();
        return label;
    }

    public void print(Object obj) {
        console.getOut().println(obj);
    }
}
| Attachments: |
|
Downloaded 291 times |