|
Attention! Read the forum rules carefully before posting a topic.
Submit JForex API bug reports in this forum only.
Submit Converter issues in Converter Issues.
Off topics are strictly forbidden.
Any topics which do not satisfy these rules will be deleted.
| mismatch between chart's data and strategy |
|
tcsabina
|
| Post subject: mismatch between chart's data and strategy |
Post rating: 1
|
 Posted: Wed 26 Mar, 2014, 23:57
|
|
User rating: 164
Joined: Mon 08 Oct, 2012, 10:35
Posts: 676
Location: NetherlandsNetherlands
|
Dear Support, I am facing again an issue with difference between chart data and strategy data. I am trying to calculate indicator values for the last 10 Renko bars. For some indicators (EMA for instance) the value I get in the strategy is identical with the data I see on the chart. But for the RSI indicator the data is different. Here is a screenshot, where I indicated the difference (the red mark show the difference for RSI, the green mark show the identical data for EMA). 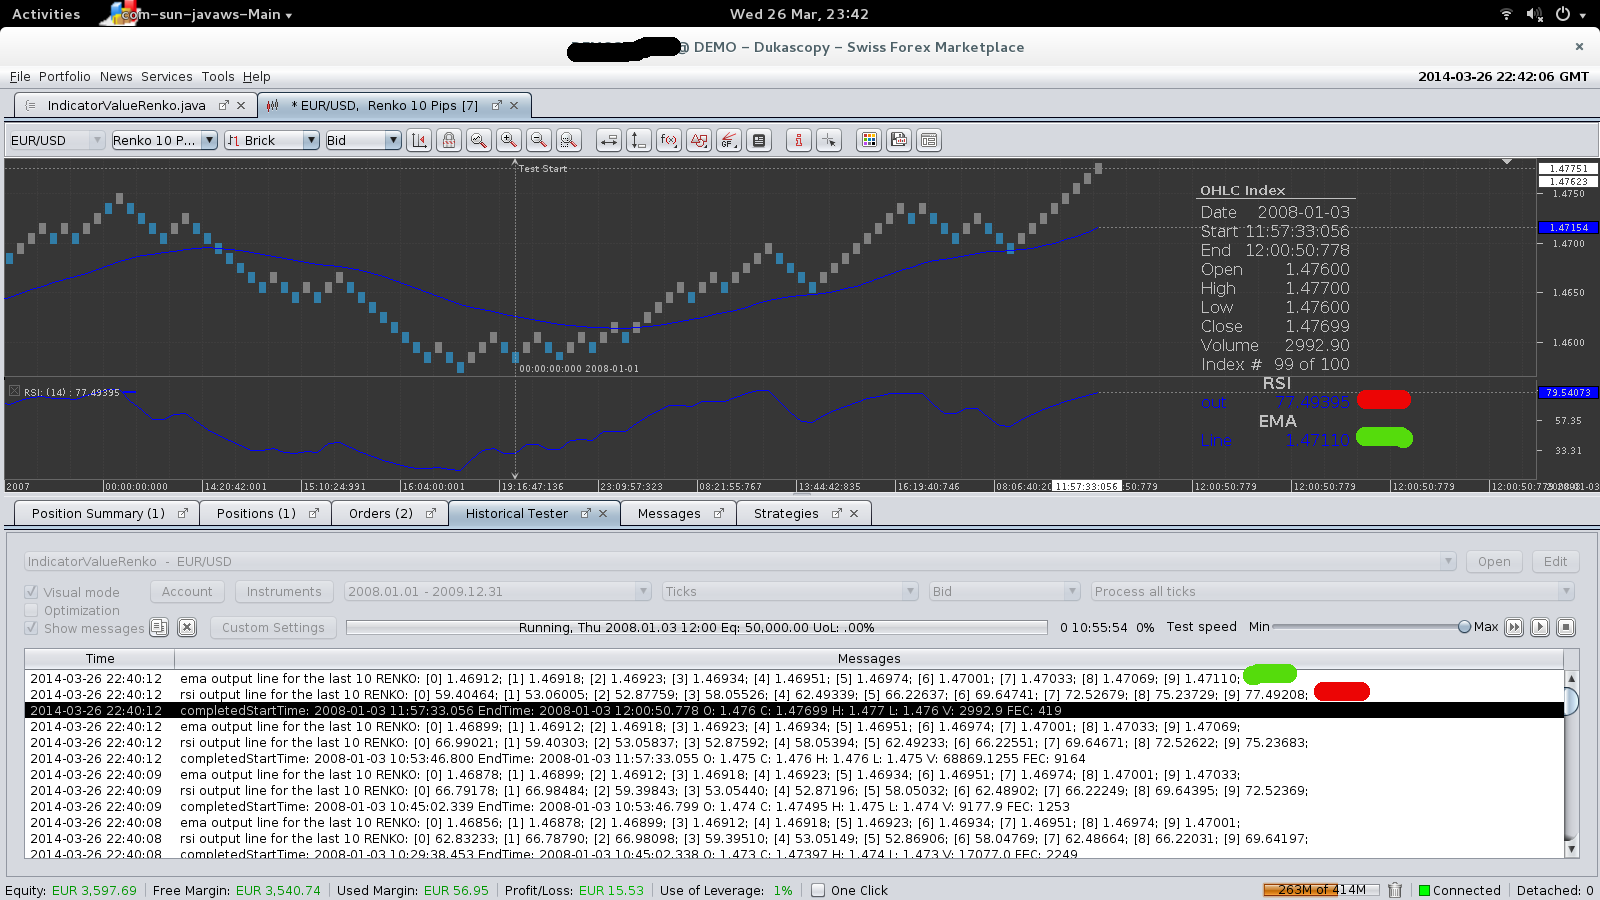 The strategy I am using is based on the wiki page of the price-feed indicator calculation. The code: package singlejartest;
import com.dukascopy.api.*;
import com.dukascopy.api.feed.IFeedDescriptor;
import com.dukascopy.api.feed.IFeedListener;
import com.dukascopy.api.feed.util.RenkoFeedDescriptor;
import com.dukascopy.api.IIndicators.AppliedPrice;
public class IndicatorValueRenko implements IStrategy, IFeedListener {
@Configurable("")
public IFeedDescriptor renkoFeedDescriptor = new RenkoFeedDescriptor(Instrument.EURUSD, PriceRange.valueOf(10), OfferSide.BID);
private IConsole console;
private IIndicators indicators;
public void onStart(IContext context) throws JFException {
this.console = context.getConsole();
this.indicators = context.getIndicators();
context.setSubscribedInstruments(java.util.Collections.singleton(renkoFeedDescriptor.getInstrument()), true);
context.subscribeToFeed(renkoFeedDescriptor, this);
}
@Override
public void onFeedData(IFeedDescriptor feedDescriptor, ITimedData feedData) {
console.getOut().println("completed" + feedData);
try {
Object[] rsiFeed = indicators.calculateIndicator(feedDescriptor, new OfferSide[] { feedDescriptor.getOfferSide() }, "RSI"
, new AppliedPrice[] { AppliedPrice.CLOSE }, new Object[] { 14 }, 10, feedData.getTime(), 0);
double[] rsi = (double[])rsiFeed[0];
print("rsi output line for the last 10 %s: %s", feedDescriptor.getDataType(), arrayToString(rsi));
Object[] emaFeed = indicators.calculateIndicator(feedDescriptor, new OfferSide[] { feedDescriptor.getOfferSide() }, "EMA"
, new AppliedPrice[] { AppliedPrice.CLOSE }, new Object[] { 30 }, 10, feedData.getTime(), 0);
double[] ema = (double[])emaFeed[0];
print("ema output line for the last 10 %s: %s", feedDescriptor.getDataType(), arrayToString(ema));
} catch (JFException e) {
console.getErr().println(e);
e.printStackTrace();
}
}
private void print(String format, Object... args) {
console.getOut().format(format, args).println();
}
private static String arrayToString(double[] arr) {
String str = "";
for (int r = 0; r < arr.length; r++) {
str += String.format("[%s] %.5f; ", r, arr[r]);
}
return str;
}
public void onAccount(IAccount account) throws JFException {}
public void onMessage(IMessage message) throws JFException {}
public void onStop() throws JFException {}
public void onTick(Instrument instrument, ITick tick) throws JFException {}
public void onBar(Instrument instrument, Period period, IBar askBar, IBar bidBar) throws JFException {}
}
What is strange also, is that for the RSI data array the array elements are changed between calls. Compared to the EMA array, where every element is shifted when a new brick is being created. So element[n] will be element[n-1]. This is nicely visible on the screenshot, or if you run the code. For the RSI array this is not the case. Every element is (slightly?) modified whenever a new brick is finished. This could be normal, if the RSI is an indicator that repaints, but is it repainting? Please take a look on this.
| Attachments: |
 Screenshot from 2014-03-26 23:42:07.png [149.03 KiB]
Downloaded 1154 times
|
Screenshot from 2014-03-26 23:42:07.png [149.48 KiB]
Downloaded 639 times
|
|
DISCLAIMER: Dukascopy Bank SA's waiver of responsability - Documents, data or information available on
this webpage may be posted by third parties without Dukascopy Bank SA being obliged to make any control
on their content. Anyone accessing this webpage and downloading or otherwise making use of any document,
data or information found on this webpage shall do it on his/her own risks without any recourse against
Dukascopy Bank SA in relation thereto or for any consequences arising to him/her or any third party from
the use and/or reliance on any document, data or information found on this webpage.
|
|
|
|
|
|
 |
|
API Support
|
| Post subject: Re: mismatch between chart's data and strategy |
Post rating: 0
|
Posted: Tue 01 Apr, 2014, 17:35
|
|
User rating: ∞
Joined: Fri 31 Aug, 2007, 09:17
Posts: 6139
|
|
RSI is of unstable period, which means that the indicator value depends on the input count, to achieve exactly the same values as shown on the chart, you would need to calculate over 100 candles.
Edit: One should not be obliged to artificially increase the required value count depending on the indicator type. We are going to fix this.
|
|
|
|
|
|
|
kurak777
|
| Post subject: Re: mismatch between chart's data and strategy |
Post rating: 0
|
Posted: Wed 02 Apr, 2014, 15:00
|
|
User rating: 7
Joined: Fri 13 Jan, 2012, 20:49
Posts: 94
Location: Poland, Warsaw
|
|
Ok. Thank you for explanation.
However could you please present a method on how to increase input count for PERSBBANDS(2000,2) so I get the same values from indicator calculation as on the chart?
Best regards,
Kurak
|
|
|
|
|
|
|
tcsabina
|
| Post subject: Re: mismatch between chart's data and strategy |
Post rating: 0
|
Posted: Fri 04 Apr, 2014, 12:08
|
|
User rating: 164
Joined: Mon 08 Oct, 2012, 10:35
Posts: 676
Location: NetherlandsNetherlands
|
API Support wrote: RSI is of unstable period, which means that the indicator value depends on the input count, to achieve exactly the same values as shown on the chart, you would need to calculate over 100 candles. I beg your pardon, but could you explain this a bit? RSI indicator has an input parameter: Time period. If I place the indicator on a chart, and set this parameter to (let's say) 20, I would expect that the rsi value is calculated on the last 20 bars. And in parallel, if I call this indicator from a strategy, with 20 as Time period, I would expect that the rsi value is being calculated by using the last 20 candles. Now, this is not the case. What do I miss here? Also, could you also reply on the other issue: Every element is (slightly?) modified whenever a new brick is finished. Currently it is impossible to rely on RSI, because if I calculate an rsi value for a Renko brick, this value will be changed whenever a next brick is ready. I am (trying!) to use the posted strategy to discover rsi crosses, but because of this issue, it is not possible.
|
|
|
|
|
|
|
CriticalSection
|
| Post subject: Re: mismatch between chart's data and strategy |
Post rating: 5
|
Posted: Fri 04 Apr, 2014, 13:38
|
|
User rating: 70
Joined: Sat 22 Sep, 2012, 17:43
Posts: 118
Location: Brazil, Fortaleza, Ceará
|
Consider this page from the TALIB website'Unstable Period' basically means that the current value you see for the calculation depends on the historical context existing before the current calculation is made. So, if we calculate RSI[14], while it's true this will involve the last 13 bars + the current 1, the nature of the formula is such that it makes a difference whether the first RSI[14] first calculated started 13 bars ago or 130 bars ago. When you load the platform there are historical candles loaded from the cache e.g. 100 candles before 'NOW'. When you place RSI[14] on the chart, the indicators starts calculating far into the left of the chart 100 candles back into the historical area. When you use the calculateIndicator() functions to invoke RSI[14] you can tell it how far back to go to start its calculations. A) 14 bars before 'NOW' if you're happy to start there returns one RSI[14] result array index [0]. B) 100 bars before 'NOW' (to match chart behaviour) working with a sliding window of 14 bars returns 87 results array indices [0] to [86]. The idea with unstable period is that RSI(14)[ current] of A cannot be the same as RSI(14)[ current] in B. After a certain number of bars however, and depending on the underlying formula, you can witness a convergence between RSI(14)[ current] of A and RSI(14)[ current] of B to where they appear very close or even identical. For some of these indicators it's important to remember that as the chart moves left, the current value you see is based on a lot of the data to the left of 'NOW'. If we make our own calculations based on only the number of bars we need to the left of 'NOW' e.g. 14, we will always see a different result. That's the general idea anyways and I hope it helps with further investigation and experimentation.
|
|
|
|
|
|
|
tcsabina
|
| Post subject: Re: mismatch between chart's data and strategy |
Post rating: 0
|
Posted: Sun 06 Apr, 2014, 22:53
|
|
User rating: 164
Joined: Mon 08 Oct, 2012, 10:35
Posts: 676
Location: NetherlandsNetherlands
|
@CriticalSection Thank you so much for the detailed answer! I am getting closer to understand this, but I am still not sure how should one call the indicator to have the same result as on the chart. How should the algorithm look like? Shall I just collect the prices of the last 100 bars whenever a new bar is created, and use these prices (100 piece) to calculate the indicator, as described here? I've found some relevant topics, but I am not sure if I am on the right track: viewtopic.php?f=65&t=49817viewtopic.php?f=65&t=44292viewtopic.php?f=65&t=44000
|
|
|
|
|
|
|
CriticalSection
|
| Post subject: Re: mismatch between chart's data and strategy |
Post rating: 3
|
Posted: Tue 08 Apr, 2014, 23:51
|
|
User rating: 70
Joined: Sat 22 Sep, 2012, 17:43
Posts: 118
Location: Brazil, Fortaleza, Ceará
|
|
It would be nice if folks who actually use these indicator APis (other than Support) would lend a helping hand. Despite a strong desire to contribute I'm not sure I'm the best person to help since I don't use the indicator subsystem.
I urge corrections to anything written here that is wrong in order to assist the OP more favourably
Anyways, from what I understand, the functions in the underlying indicator library powering JForex have no knowledge of the JForex platform itself. Each indicator function e.g. indlibMACD takes a reference to an array of input prices as well as indicator parameters e.g. 12,26,9 and spits out the results to an output array(s) e.g. MACD, MACD_SIGNAL also taken in as a reference to the function.
When you ask JForex for RSI[14] (using the universal indicators.calculateIndicator) you have to give the underlying indlibRSI function an input array of prices with at least 14 price points to work with (or rather the JForex API has to give the underlying indlibRSI function the input array of the at least 14 price points) as well as other useful information for the underlying indlibXXXX function to make calculations.
In the initial post, there is a call to feedData.getTime(), with a number '10' preceding it.
If tS = feedData.getTime(), these parameters mean, we would like the RSI[14] answer at the point 'tS' and well as the same for all 9 candles before 'tS' (i.e. 10 results inclusive of 'tS').
Now consider the resulting array. Notice that it is back to front i.e. instead of the 'current bar' result being at doubleArray[0] it's at doubleArray[9]. The reason for this is because by providing number of candles before, you are also telling the function how far back in terms of candles to go to begin calculating.
So by saying 10, that means lets back up 9 bars from 'tS'. Now we're here, we need to observe the '14' periods requirement for our result[0].
As we move back up towards 'tS' we arrive at result[9] (the current bar at 'tS').
Now about the 14 period requirement, when we back up 9 bars to the left to get result[0], calculating result[0] will involve backing up a further 13 bars to collect 14 periods (13 back plus where we are now) to place an answer into result[0]. It is the price candles in this range back up towards 'tS' that become the input array to indlibRSI.
All it sees are a list of numbers with no other context to calculate over - this point is important.
If there was context, '10' would be 10 into an existing price array maintained by JForex already matching up with the chart prices no matter what was happening historical cache wise to the left.
When we move 1 towards 'tS' to generate result[1], we will again back up 13 bars to collect 14 periods and generate result[1].
The trick to easily miss is that a lot of formulas are also including the result of result[0] into the generation of result[1] and so on (on top of or as part of the 14 candle period calculations).
This is how the distance we go back affects what we see when we end up at 'tS'.
The GOOD:
Support suggested for you to begin to see the sort of values that you want, you don't want to look back 10 bars but around 100 bars.
It's not important how many actual results you want to take (result[9], result[8], result[7], etc) what's important is the number affects what u see at the end of the array (current bar result).
So with '100', your call would back up 99 bars and start calculating RSI[14] (result[0] to result[99]). This is potentially enough 'distance' to allow the RSI calculations to stabalise and look similar to what see on the chart. How quickly stabalisation happens depends on the actual indicator and the nature of its underlying formula.
So throw a '100' in there above instead of '10' and see what you think of the results.
The BAD:
As the chart is moving to the right, that left hand candle you look back to is moving also. If you use a lookback of '100', then all indicator formulas that stabalise within 100 candles will be ok as the 100 lookback window also moves. Others that don't stabalise within the window will always require the very first left hand candle (or at least more candles to the left than you've allowed) to be included (even as and after the chart starts moving) in order for you to see the same result to the right. So, the reality then is that (according to my understanding at least), the only way to truly replicate the chart accurately in all situations is to call the indicator function not with 10 and not with 100 but with a variable 'vLookback' number that increases by 1 everytime a new bar is formed. So you would set it to 100 at the very beginning to capture chart cache history*. And every time a new bar formed do a vLookback++. This means that you are always making use of all the bars in the session to the left to generate the results seen at the current bar at the right. Obviously this is far from efficient*. So with a little investigation and experimentation we can for each indicator look for a constant number cLookback e.g. 10, 100, 500, 1000 number of bars over which the indicator stabalises out and reflects what we see to the right of the chart as closely as possible.
Note: When you said in your first post that RSI values were changing everytime there was a new brick, that's because '10' bars lookback isn't enough for the RSI to stabalise with the first calculation kicking off 10 bars before 'NOW' (also each new brick the 'price' bar kicking off the calculation has changed). 100 might to the trick. You might need more. When you find this number that works. It may work or not work for other indicators. This is the essence of unstable periods and making use of the universal functions to pass in 'x' bars for results within your strategy. It's all happening with no reference to the price chart itself (including knowledge of exactly at which bar it was the indicators placed on the price chart began calculating).
*My existing approach (which may not even be a good one):
Since I had to be sure that any indicator logic could port consistently across languages, brokers and APIs, I chose to implement indicators of interest to me myself.
I use a lookback of 4000 candles (again you might find 100 cited above to be arbitrary or inconsistent depending on the indicators you use) which are obtained from IHistory (when connected to JForex otherwise in-memory cache) to start with i.e. 4000 candles before 'NOW. These prices are placed into a circular buffer. There are circular buffers of the same size for each set of indicator results I'm interested in. Beginning from the left (3999 bars back in history before 'NOW') I start calculating for example RSI 14 from candle 3986 back or EMA 5 from candle 3995 back all the way up to NOW. That means before the chart starts moving (well it's all done in real time while it's already moving but that's another issue) I have 4000 candles worth of indicator data sitting in circular buffers. So as the first bar kicks in, the first result calculated for 'NOW' is based on values to the left of it up to 4000 bars back if need be so I reasonably don't worry about 'unstablePeriod'. The reason the buffers are circular is because as the chart keepings moving over the daily or weekly trading session, I need the new values (price, indicators results) to overwrite the old ones. But in every case 'NOW' calculations include 4000 bars of historical indicator results and price as needed. I use 4000 (my own 'cLookback') as a general window to cater for proprietary indicators in the future that may study a high number of periods (say 3500 to yield 500 initial indicator results before 'NOW') yet still have unstable periods. The codebase is designed to allow different researchers to develop different strategy styles that run simultaneously against shared price and source data buffers so I have to be sure that the buffer functions are consistent for both short term and longer term styles. One strategy wants to calculate EMA[5]s another wants EMA[750]s from the price buffer. Another wants the last 14 HMA[12] results while another wants the last 365 HMA[12] results from the HMA[12] buffer. Another might want to study 240 Daily Opens and Vols while still another might want to compare in realtime the results of an EMA Cross approach kicked off 365 days ago with an HMA cross one kicked off 730 days ago and infer from this a perspective on price right now.
I should note that in general I am less concerned about matching the values in JForex charts and more interested in making sure 'unstablePeriod' is not an issue for large period studies and that any strategies developed based on any indicator buffers can rely on consistent values irrespective of programming language, broker price feed or broker API.
|
|
|
|
|
|
|
tcsabina
|
| Post subject: Re: mismatch between chart's data and strategy |
Post rating: 1
|
Posted: Thu 10 Apr, 2014, 09:30
|
|
User rating: 164
Joined: Mon 08 Oct, 2012, 10:35
Posts: 676
Location: NetherlandsNetherlands
|
Thanks CriticalSection, again, for you detailed, insight explanation! I've modified the example strategy to use 1000 bricks, but still, there is a difference between chart and strategy data: 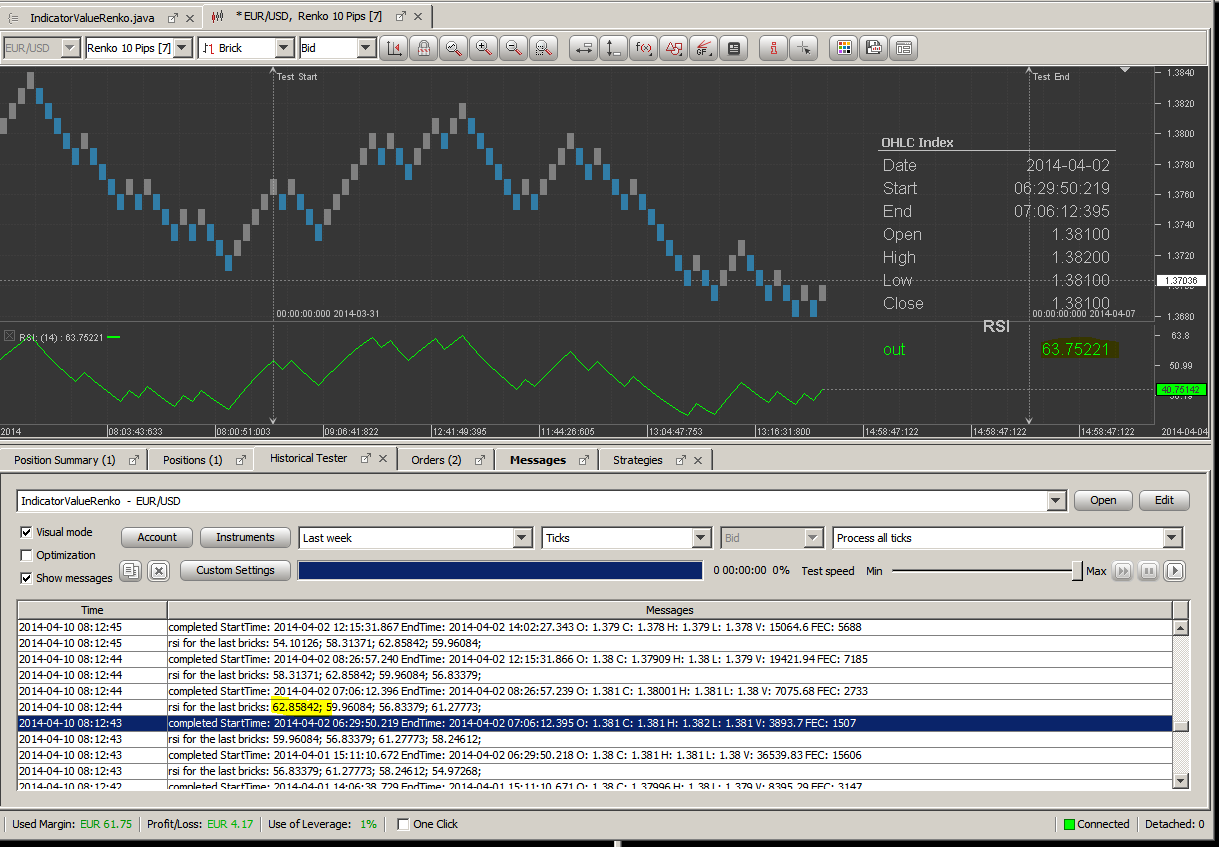 Here is the modified strategy: package singlejartest;
import com.dukascopy.api.*;
import com.dukascopy.api.feed.IFeedDescriptor;
import com.dukascopy.api.feed.IFeedListener;
import com.dukascopy.api.feed.util.RenkoFeedDescriptor;
import com.dukascopy.api.IIndicators.AppliedPrice;
public class IndicatorValueRenko implements IStrategy, IFeedListener {
@Configurable("")
public IFeedDescriptor renkoFeedDescriptor = new RenkoFeedDescriptor(Instrument.EURUSD, PriceRange.valueOf(10), OfferSide.BID);
private IConsole console;
private IIndicators indicators;
public void onStart(IContext context) throws JFException {
this.console = context.getConsole();
this.indicators = context.getIndicators();
context.setSubscribedInstruments(java.util.Collections.singleton(renkoFeedDescriptor.getInstrument()), true);
context.subscribeToFeed(renkoFeedDescriptor, this);
}
@Override
public void onFeedData(IFeedDescriptor feedDescriptor, ITimedData feedData) {
console.getOut().println("completed " + feedData);
try {
Object[] rsiFeed = indicators.calculateIndicator(feedDescriptor, new OfferSide[] { feedDescriptor.getOfferSide() }, "RSI"
, new AppliedPrice[] { AppliedPrice.HIGH }, new Object[] { 14 }, 1000, feedData.getTime(), 0);
double[] rsi = (double[])rsiFeed[0];
print("rsi for the last bricks: %.5f; %.5f; %.5f; %.5f;", rsi[999], rsi[998], rsi[997], rsi[996]);
} catch (JFException e) {
console.getErr().println(e);
e.printStackTrace();
}
}
private void print(String format, Object... args) {
console.getOut().format(format, args).println();
}
private static String arrayToString(double[] arr) {
String str = "";
for (int r = 0; r < arr.length; r++) {
str += String.format("[%s] %.5f; ", r, arr[r]);
}
return str;
}
public void onAccount(IAccount account) throws JFException {}
public void onMessage(IMessage message) throws JFException {}
public void onStop() throws JFException {}
public void onTick(Instrument instrument, ITick tick) throws JFException {}
public void onBar(Instrument instrument, Period period, IBar askBar, IBar bidBar) throws JFException {}
}
In the meanwhile there was a bug registered with Renko feeds: viewtopic.php?f=85&t=50994Could this bug be related to the difference I've seen? Finally, I would really appreciate a response from Support (with hopefully a working code), as we all might be guessing this and that, but an official reply is still yet to be told.
| Attachments: |
Capture.PNG [86.91 KiB]
Downloaded 1074 times
|
|
DISCLAIMER: Dukascopy Bank SA's waiver of responsability - Documents, data or information available on
this webpage may be posted by third parties without Dukascopy Bank SA being obliged to make any control
on their content. Anyone accessing this webpage and downloading or otherwise making use of any document,
data or information found on this webpage shall do it on his/her own risks without any recourse against
Dukascopy Bank SA in relation thereto or for any consequences arising to him/her or any third party from
the use and/or reliance on any document, data or information found on this webpage.
|
|
|
|
|
|
|
|
CriticalSection
|
| Post subject: Re: mismatch between chart's data and strategy |
Post rating: 0
|
Posted: Thu 10 Apr, 2014, 11:04
|
|
User rating: 70
Joined: Sat 22 Sep, 2012, 17:43
Posts: 118
Location: Brazil, Fortaleza, Ceará
|
|
I don't know anything about RenkoBars actually but you'd want to be sure that the RSI is being calculated against an applied price list of HIGHs (for that second strategy posted) and not CLOSEs (as you had in the first strategy) for your comparisons.
Also 'matching' might be ambitious at times, sometimes what you want is 'near enough' or 'close enough'.
Looking at the tester there's data already loaded before 'Test Start', did you check it was 1000 candles? That green line starts far into the left and the value you see to the right for RSI depends on the bar used to calculate the first one.
If I remember correctly it can be as many as 4000, so try this number and see what you think.
As for the bug, anything that affects the CLOSE prices could be an issue. If the indicator calculation function is loading bars from IHistory and this feed is clean, while the platform charts internal pricing buffers are bad/corrupted, then they'd be a discrepancy.
Hope this helps.
|
|
|
|
|
|
|
tcsabina
|
| Post subject: Re: mismatch between chart's data and strategy |
Post rating: 0
|
Posted: Thu 10 Apr, 2014, 11:22
|
|
User rating: 164
Joined: Mon 08 Oct, 2012, 10:35
Posts: 676
Location: NetherlandsNetherlands
|
|
The AppliedPrice indeed changed in the strategy. But both the chart's RSI, and the strategy's RSI is using the same, AppliedPrice.HIGH.
But thanks for the hint!
I haven't checked that there are 1000 bricks really available to the 'left'. The tester was run against 'Last Week'. So there must be enough bar in the history, to the 'left'.
I know you have mentioned 4000.
Support mentioned 100, so I tried with that number. 100 was not okay, so I increased to 1000, and posted the results.
I will test with 4000, however I am a bit afraid of the increased indicator calculation time... But if that solves the mismatch, I can live with that.
About accuracy:
the 0.5 difference is too big, IMHO. I could accept difference up to 0.09 only (so the integer part at least always precise).
|
|
|
|
|
|
|
CriticalSection
|
| Post subject: Re: mismatch between chart's data and strategy |
Post rating: 1
|
Posted: Thu 10 Apr, 2014, 11:51
|
|
User rating: 70
Joined: Sat 22 Sep, 2012, 17:43
Posts: 118
Location: Brazil, Fortaleza, Ceará
|
'Last Week' means the date at 'Test Start' is from say last week Thursday. Then you consider the cached values to the left. We can't just start calculating indicators at 'Test Start', we need bars to get first values. Also of course you will be worried about indicator calculation time, you're trying to do something you actually don't have to. The platform is used to trade manually. It can load any historical length it wants to and start calculating indicators at any point it wants to. It's all arbitrary. Your job is to understand the RSI itself, work out how many bars you want as 'lead up' before you start using its results. The platform's chart values are irrelevant to your strategy.Consider the following extract from the link above: Quote: The more data points that are used to calculate the RSI, the more accurate the results. The smoothing factor is a continuous calculation that - in theory - takes into account all of the closing values in the data set. Quote: If you start an RSI calculation in the middle of an existing data set, your values will only approximate the true RSI value. SharpCharts uses at least 250 data points prior to the starting date of any chart (assuming that much data exists) when calculating its RSI values. To duplicate its RSI number, you'll need to use at least that much data also. Now practically, of course, when we backtesting/demoing and placing built-in indicators onto the chart, it helps to see visually the same values which the strategy is also seeing which is why we seek to match everything up. The number '100' Support has given might relate to the demo/live charts when you open those, a general period window over which a number of indicators sync out or the platform's RSI lookback specifically, but I believe the tester loads way more than that. That green RSI line begins more than 100 periods before 'Test Start'. If I remember correctly, in the early days I dealt with this issue dynamically by doing a getChart() and querying the number of candles there at the beginning when the strategy starts. What is important is that the number makes a difference as the initial value affects every RSI result going forward.
|
|
|
|
|
|
|
API Support
|
| Post subject: Re: mismatch between chart's data and strategy |
Post rating: 0
|
Posted: Fri 11 Apr, 2014, 09:42
|
|
User rating: ∞
Joined: Fri 31 Aug, 2007, 09:17
Posts: 6139
|
tcsabina wrote: Finally, I would really appreciate a response from Support (with hopefully a working code), as we all might be guessing this and that, but an official reply is still yet to be told. We managed to replicate this, it appears that a certain amount of the last values are off. Regarding our second post, our reply was not entirely correct - one should not be obliged to artificially increase the required value count depending on the indicator type. We are going to fix this.
|
|
|
|
|
|
|
tcsabina
|
| Post subject: Re: mismatch between chart's data and strategy |
Post rating: 0
|
Posted: Sun 27 Apr, 2014, 22:16
|
|
User rating: 164
Joined: Mon 08 Oct, 2012, 10:35
Posts: 676
Location: NetherlandsNetherlands
|
|
Hello Support,
Could you give us an update on this case, please?
The problem has been found. Any news about the fix?
Thanks and regards.
|
|
|
|
|
|
|
API Support
|
| Post subject: Re: mismatch between chart's data and strategy |
Post rating: 0
|
Posted: Tue 29 Apr, 2014, 15:34
|
|
User rating: ∞
Joined: Fri 31 Aug, 2007, 09:17
Posts: 6139
|
|
The issue has already been registered and will get fixed as soon as available.
|
|
|
|
|
|
 
|
Pages: [
1
]
|
|
|

|
|


