Hi ,
I'll try re-installing tomorrow at work.
Now back to the issue at hand:
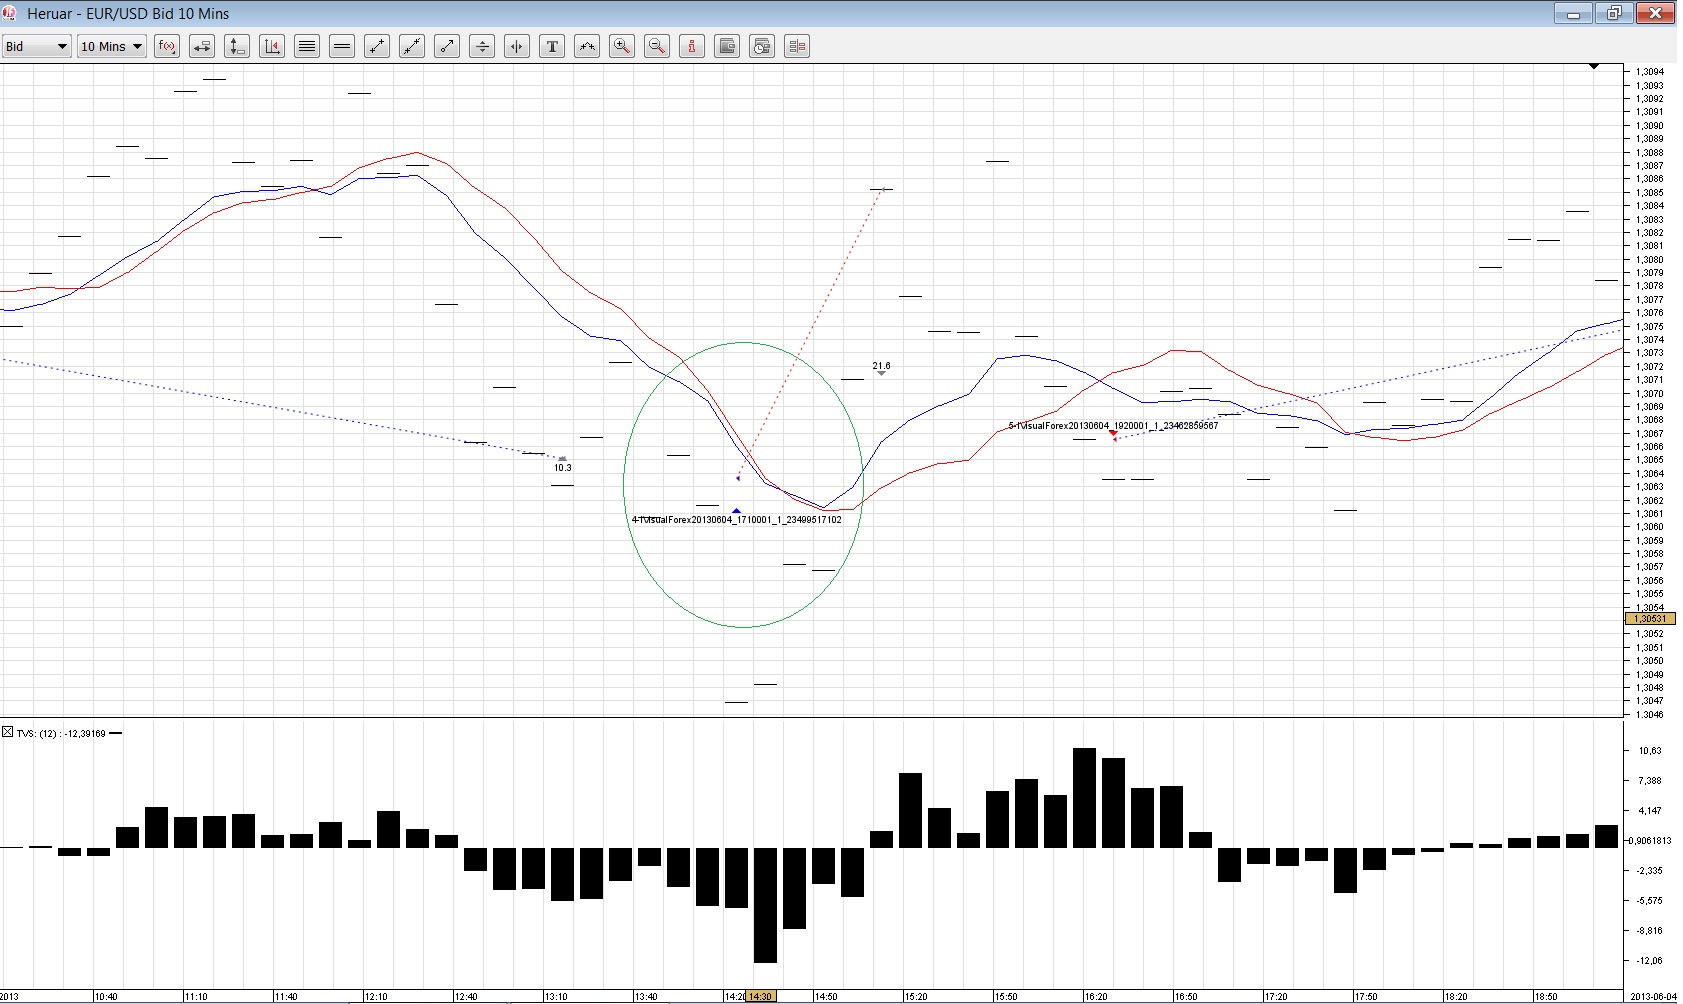
I attached a historical test to show what I meant with the first post.
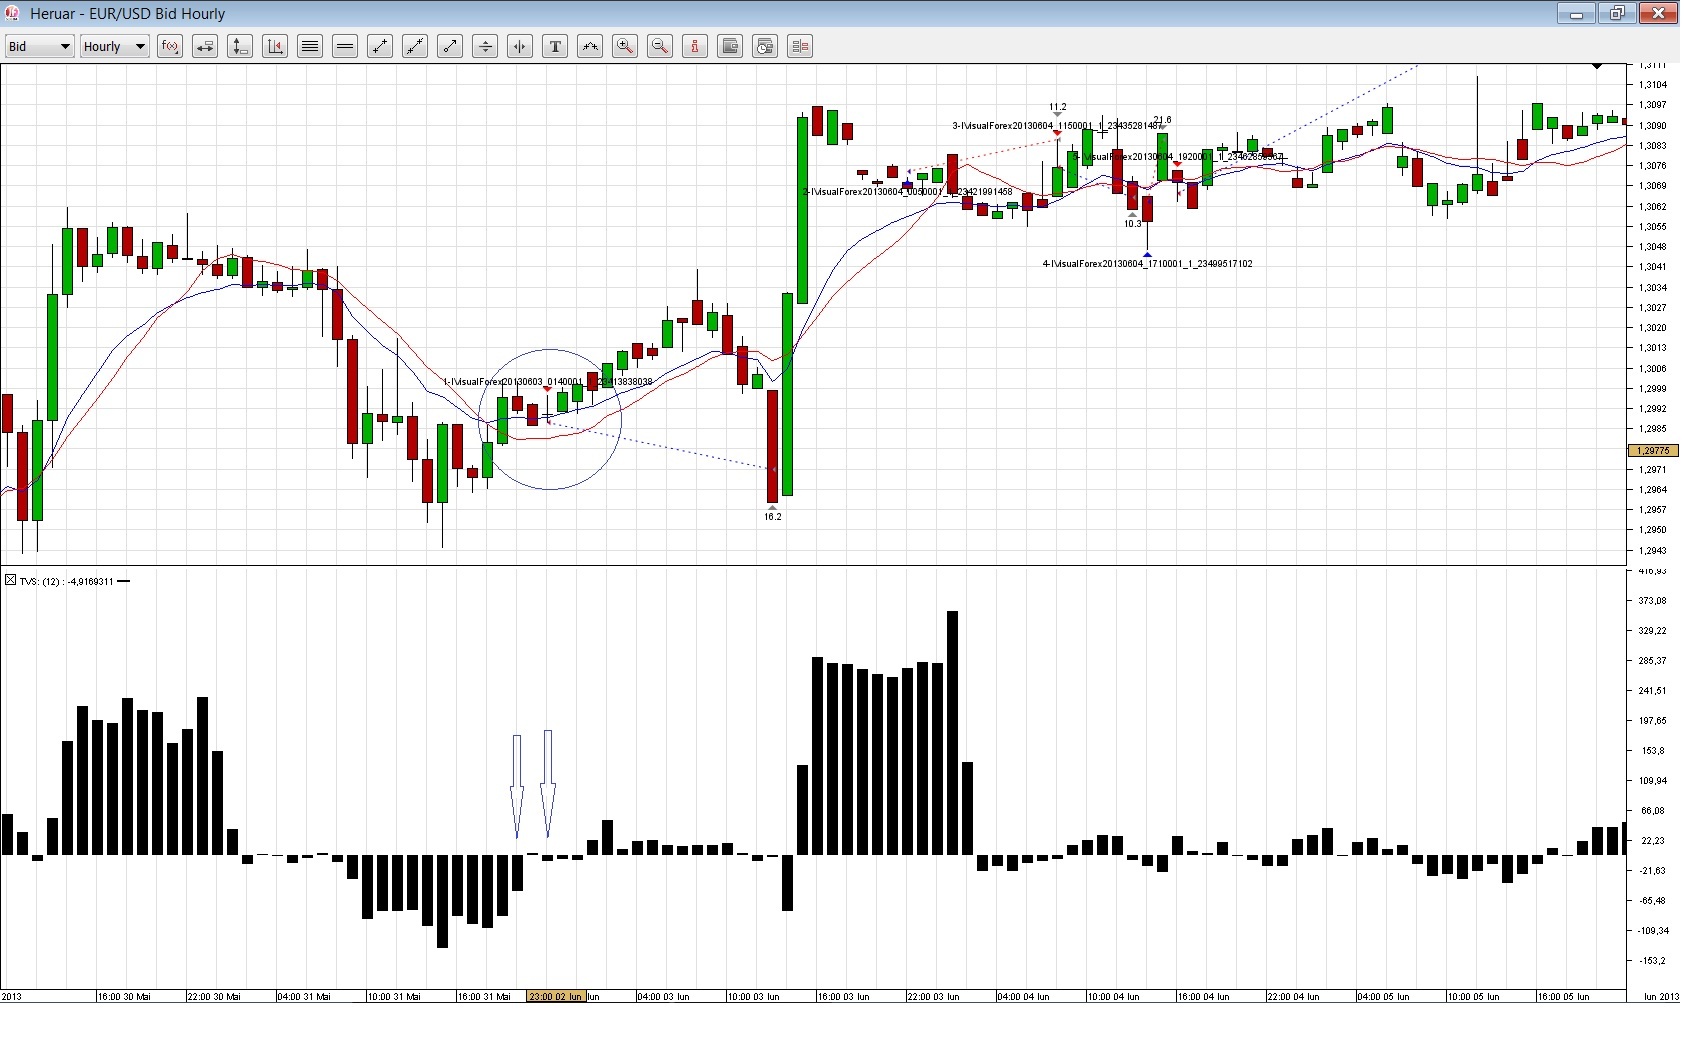
As you can see in the image, TVS1 and TVS2 are bellow 0, but TVS1 is higher than TVS2, and SMA is lower than EMA and the strategy chose SELL command.
It doesn't make any sense. This test was made with the modifications you made.
I'm starting to think the strategy is fine and the problem is either server side or with Visual JForex...
I don't know anymore.
Maybe someone who programmed the software can help ?
Thank you.
Cheers
Edit: I just noticed the graph is Hourly and my strategy is in 10 min bars... The output of the historical tester is wrong. Now I changed the graph to 10min and all I see are some small lines as attached. Some conditions are good but some are not.