Show panel Hide panel

Best wins View all achievements

Show panel Hide panel

Last 3 posts Show blog

Avatar

EUR USD to go further down on technical charts.

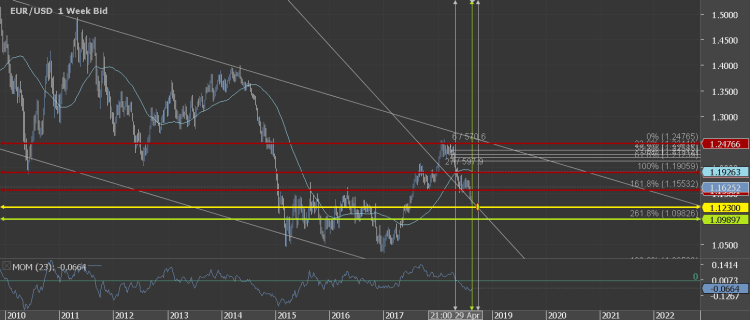
EUR USD was on an uptrend since december 2016 an started falling since Jan 2018. This downtrend will further continue as the tech charts show long term reversal on weekly charts. which is confirmed by momentum 23 and moving average 50 indicators
Target 1: 1.1550
Target 2: 1.1230
Stop loss: 1.1900
Daily Chart confirms the movement towards the target prices
Monthly charts show long term downtrend which is expected to follow
Ler história completa
Traduzir para Inglês Mostrar original
agrawal4443 avatar

take profit 1 achieved on 10 september.

oudeixar comentários
Avatar

AUD/USD bullish on technical charts

AUDUSD has been on a downtrend since January this year, But daily charts now show a reversal which is confirmed by moving average 50 and momentum 23 indicators. Fib retracements gives expected levels and a parallel climb gives expected Aud USD value on 1st October 2018.
Target 1: 0.7465
Target 2: 0. 7600( though expected price as per chart is higher but FIB 261 hits at 7600) just in case there is reversal here
Stop loss: 0.7200
The upward trend is confirmed by the weekly chart which has hit yet …
Ler história completa
Traduzir para Inglês Mostrar original
agrawal4443 avatar

stop loss hit.

oudeixar comentários
Avatar

USD/JPY to see further downfall. 107-108 expected

USD JPY has seen great fall since past 1 month. The trend shows clear reversal of previous uptrend on daily charts. Which is confirmed by Momentum and Moving average indicators.
Take Profit 1 : 109.70
Take profit 2 : 107.70
Stop loss : 112.90 after which it will continue uptrend.
Daily Chart: Green shows Target area
Weekly Chart : Confirms Downtrend.
Monthly Chart: Shows Uptrend Reversal on even a longer term.
Ler história completa
Traduzir para Inglês Mostrar original
agrawal4443 avatar

take profit 1 achieved on 21st august

oudeixar comentários