Hello Duka.
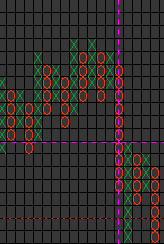
More examples of strange P&F charts. Somehow the X and O do not always show correct. But also gaps appear (see example) and parts of the chart disappear. On EUR USD from today P&F says that price only went down by more then 20 pips between 0:00 and 8:00 GMT.
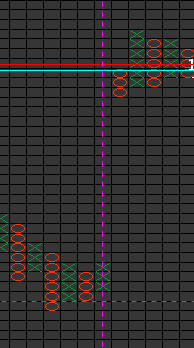
Today's AUD JPY 2/3 p&f does not even show up for today. It stops yesterday.
Most of the time the problem is solved by closing the entire chart and making a new one. Changing between timeframes is a pain in the ass this way.
BTW: this is in DEMO mode.