|
Attention! Read the forum rules carefully before posting a topic.
Try to find an answer in Wiki before asking a question.
Submit programming questions in this forum only.
Off topics are strictly forbidden.
Any topics which do not satisfy these rules will be deleted.
| Ticks |
|
david7000
|
| Post subject: Ticks |
Post rating: 0
|
 Posted: Thu 18 Sep, 2014, 17:57
|
|
User rating: 0
Joined: Wed 26 Jun, 2013, 23:18
Posts: 20
Location: France, Paris
|
Hi, I tested this strategy to use the units in ticks, but the data display. But the display is done every 12 seconds on average. Is it possible to display the data in real time? Are there any other possibilities to use the ticks? Thank you, David 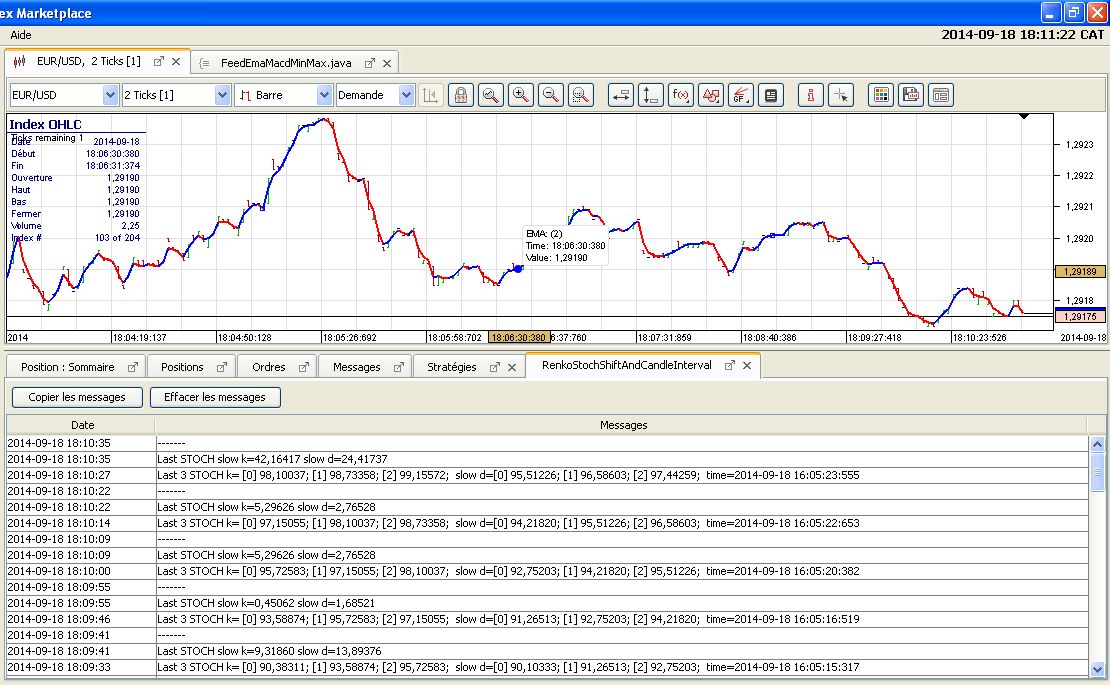
| Attachments: |
 RenkoStochShiftAndCandleInterval.jpg [189.69 KiB]
Downloaded 318 times
|
RenkoStochShiftAndCandleInterval.java [4.4 KiB]
Downloaded 63 times
|
|
DISCLAIMER: Dukascopy Bank SA's waiver of responsability - Documents, data or information available on
this webpage may be posted by third parties without Dukascopy Bank SA being obliged to make any control
on their content. Anyone accessing this webpage and downloading or otherwise making use of any document,
data or information found on this webpage shall do it on his/her own risks without any recourse against
Dukascopy Bank SA in relation thereto or for any consequences arising to him/her or any third party from
the use and/or reliance on any document, data or information found on this webpage.
|
|
|
|
|
|
 |
|
API Support
|
| Post subject: Re: Ticks |
Post rating: 0
|
Posted: Fri 19 Sep, 2014, 08:07
|
|
User rating: ∞
Joined: Fri 31 Aug, 2007, 09:17
Posts: 6139
|
david7000 wrote: But the display is done every 12 seconds on average. What do you mean? What feed have you selected from the strategy and which one is on the chart? david7000 wrote: Are there any other possibilities to use the ticks? Do you mean DataType.TICKS or DataType.TICK_BAR?
|
|
|
|
|
|
|
david7000
|
| Post subject: Re: Ticks |
Post rating: 0
|
Posted: Fri 19 Sep, 2014, 11:10
|
|
User rating: 0
Joined: Wed 26 Jun, 2013, 23:18
Posts: 20
Location: France, Paris
|
|
Yes, the feed from strategy and which one is on the chart.
i mean DataType.TICK_BAR.
thank you
|
|
|
|
|
|
|
API Support
|
| Post subject: Re: Ticks |
Post rating: 0
|
Posted: Fri 19 Sep, 2014, 11:47
|
|
User rating: ∞
Joined: Fri 31 Aug, 2007, 09:17
Posts: 6139
|
API Support wrote: david7000 wrote: But the display is done every 12 seconds on average. What do you mean? Please elaborate on this part.
|
|
|
|
|
|
|
david7000
|
| Post subject: Re: Ticks |
Post rating: 0
|
Posted: Fri 19 Sep, 2014, 12:54
|
|
User rating: 0
Joined: Wed 26 Jun, 2013, 23:18
Posts: 20
Location: France, Paris
|
As you even on this screenshot, the results display a EMA2 over 2 Tiks interval therefore every 12 seconds on average. Can be displayed in real time? Thank you 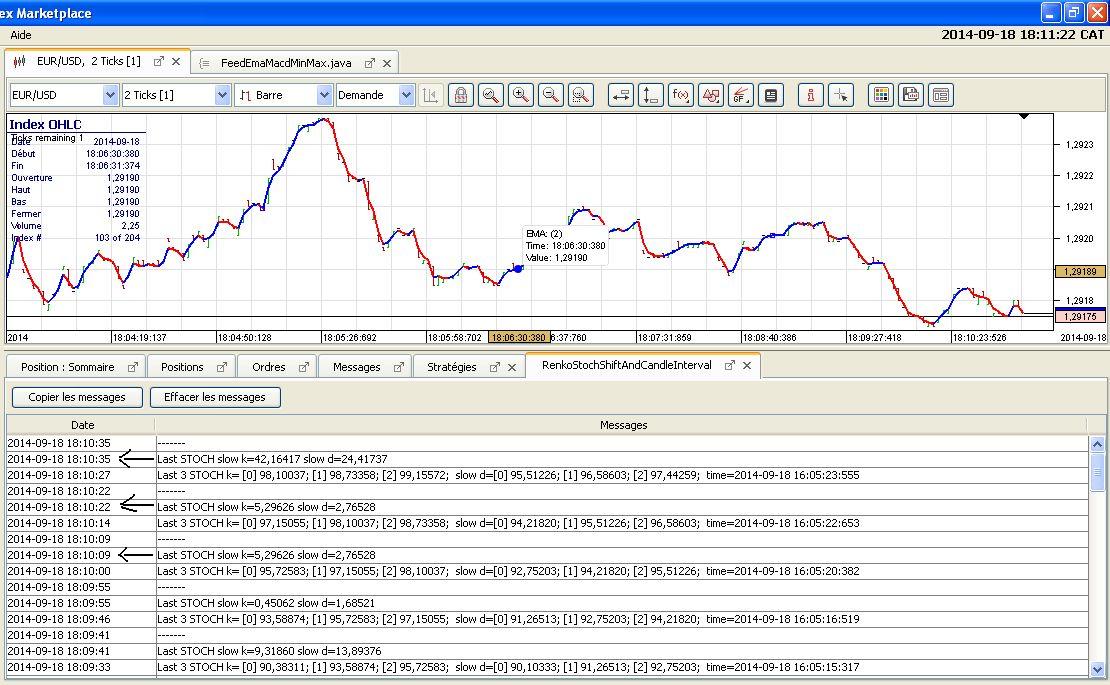
| Attachments: |
RenkoStochShiftAndCandleInterval.jpg [175.95 KiB]
Downloaded 326 times
|
|
DISCLAIMER: Dukascopy Bank SA's waiver of responsability - Documents, data or information available on
this webpage may be posted by third parties without Dukascopy Bank SA being obliged to make any control
on their content. Anyone accessing this webpage and downloading or otherwise making use of any document,
data or information found on this webpage shall do it on his/her own risks without any recourse against
Dukascopy Bank SA in relation thereto or for any consequences arising to him/her or any third party from
the use and/or reliance on any document, data or information found on this webpage.
|
|
|
|
|
|
|
|
API Support
|
| Post subject: Re: Ticks |
Post rating: 0
|
Posted: Fri 19 Sep, 2014, 14:13
|
|
User rating: ∞
Joined: Fri 31 Aug, 2007, 09:17
Posts: 6139
|
|
The indicator calculation takes too long time, we are going to investigate on this.
|
|
|
|
|
|
|
david7000
|
| Post subject: Re: Ticks |
Post rating: 0
|
Posted: Fri 19 Sep, 2014, 21:38
|
|
User rating: 0
Joined: Wed 26 Jun, 2013, 23:18
Posts: 20
Location: France, Paris
|
Hi, I have the same problem with this strategy from wiki dukascopy. Thank you 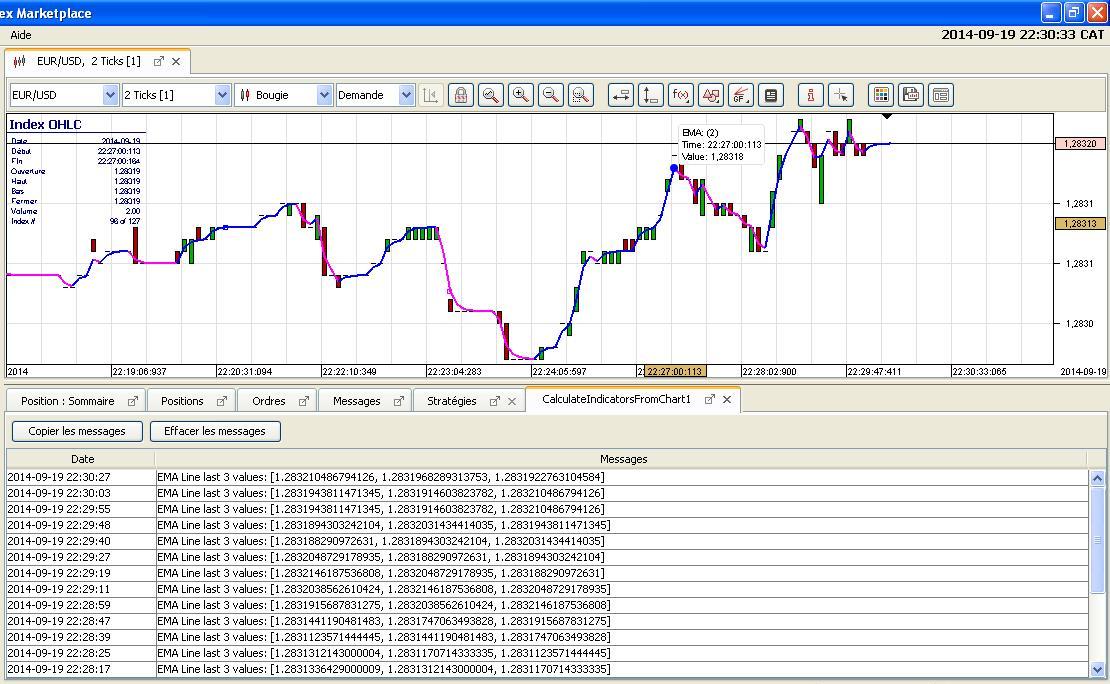
| Attachments: |
CalculateIndicatorsFromChart.JPG [169.49 KiB]
Downloaded 266 times
|
CalculateIndicatorsFromChart.java [4.09 KiB]
Downloaded 58 times
|
|
DISCLAIMER: Dukascopy Bank SA's waiver of responsability - Documents, data or information available on
this webpage may be posted by third parties without Dukascopy Bank SA being obliged to make any control
on their content. Anyone accessing this webpage and downloading or otherwise making use of any document,
data or information found on this webpage shall do it on his/her own risks without any recourse against
Dukascopy Bank SA in relation thereto or for any consequences arising to him/her or any third party from
the use and/or reliance on any document, data or information found on this webpage.
|
|
|
|
|
|
|
|
API Support
|
| Post subject: Re: Ticks |
Post rating: 0
|
Posted: Fri 28 Nov, 2014, 10:18
|
|
User rating: ∞
Joined: Fri 31 Aug, 2007, 09:17
Posts: 6139
|
|
Please run the attached strategy and post it's result from console.
| Attachments: |
PerformanceTest.java [5.1 KiB]
Downloaded 54 times
|
|
DISCLAIMER: Dukascopy Bank SA's waiver of responsability - Documents, data or information available on
this webpage may be posted by third parties without Dukascopy Bank SA being obliged to make any control
on their content. Anyone accessing this webpage and downloading or otherwise making use of any document,
data or information found on this webpage shall do it on his/her own risks without any recourse against
Dukascopy Bank SA in relation thereto or for any consequences arising to him/her or any third party from
the use and/or reliance on any document, data or information found on this webpage.
|
|
|
|
|
|
|
 
|
Pages: [
1
]
|
|
|

|
|