|
Attention! Read the forum rules carefully before posting a topic.
Try to find an answer in Wiki before asking a question.
Submit programming questions in this forum only.
Off topics are strictly forbidden.
Any topics which do not satisfy these rules will be deleted.
| CustomCandleIndicator for 100 Tickbars - help needed |
|
ccadar
|
| Post subject: CustomCandleIndicator for 100 Tickbars - help needed |
Post rating: 0
|
 Posted: Sun 31 Aug, 2014, 11:21
|
|
User rating: 3
Joined: Mon 05 Nov, 2012, 11:56
Posts: 80
Location: Germany,
|
Dear Support, I'm trying to modify the code of the "CustomCandleIndicator.java" (attached) from jforex API in order to be able to draw custom Tickbars candles on the chart. Could you please give me some hints? I'm totally lost in rewriting the "calculate" function. On the other hand I think I must use the history.getTickBar(Instrument, OfferSide.ASK, TickBarSize.valueOf(100), i); function to get the tickbars candles if I'm not wrong. Thank you.
| Attachments: |
 CustomCandleIndicator.java [10 KiB]
Downloaded 341 times
|
|
DISCLAIMER: Dukascopy Bank SA's waiver of responsability - Documents, data or information available on
this webpage may be posted by third parties without Dukascopy Bank SA being obliged to make any control
on their content. Anyone accessing this webpage and downloading or otherwise making use of any document,
data or information found on this webpage shall do it on his/her own risks without any recourse against
Dukascopy Bank SA in relation thereto or for any consequences arising to him/her or any third party from
the use and/or reliance on any document, data or information found on this webpage.
|
|
|
|
|
|
 |
|
API Support
|
 |
Post subject: Re: CustomCandleIndicator for 100 Tickbars - help needed |
Post rating: 0
|
Posted: Tue 02 Sep, 2014, 14:57
|
|
User rating: ∞
Joined: Fri 31 Aug, 2007, 09:17
Posts: 6139
|
The task would be much easier to be done from a strategy, consider the following example:
public class CustomFeedCandles implements IStrategy, IFeedListener {

    @Configurable("")
    public Instrument chartInstrument = Instrument.EURUSD;
    @Configurable("")
    public IFeedDescriptor feedDescriptor = new TickBarFeedDescriptor(Instrument.EURUSD, TickBarSize.valueOf(20), OfferSide.ASK);
    @Configurable("")
    public int initialCandleCount = 20;

    private IChart chart;
    private IHistory history;
    private IConsole console;

    @Override
    public void onStart(IContext context) throws JFException {
        this.history = context.getHistory();
        this.console = context.getConsole();
        chart = context.getChart(chartInstrument);
        if(chart == null){
            console.getErr().println("No chart found for " + chartInstrument);
            context.stop();
        }
        if(feedDescriptor.getDataType() == DataType.TICKS){
            console.getErr().println("Can't work with ticks");
            context.stop();
        }
        ITimedData lastTimedData = history.getFeedData(feedDescriptor, 1);
        //use the same listener "this" for live data subscription and historical data async read
        context.subscribeToFeed(feedDescriptor, this);
        history.readFeedData(feedDescriptor, 20, lastTimedData.getTime(), 0, this, new EmptyListener());
    }

    @Override
    public void onFeedData(IFeedDescriptor feedDescriptor, ITimedData feedData) {
        if(feedData instanceof IPriceAggregationBar){
            drawCandle((IPriceAggregationBar)feedData, ((IPriceAggregationBar) feedData).getEndTime());
        } else if(feedData instanceof IBar){
            drawCandle((IBar)feedData, feedData.getTime() + feedDescriptor.getPeriod().getInterval());
        }
    }
    private void drawCandle(IBar bar, long endTime){
        long midTime = bar.getTime() + (endTime - bar.getTime())/2;
        IRectangleChartObject rectangle = chart.getChartObjectFactory().createRectangle("rect_" + bar.getTime(), bar.getTime(), bar.getOpen(), endTime, bar.getClose());
        IShortLineChartObject line = chart.getChartObjectFactory().createShortLine("line_" + bar.getTime(), midTime, bar.getLow(), midTime, bar.getHigh());

        Color color = bar.getClose() > bar.getOpen() ? Color.GREEN.darker() : Color.RED.darker();
        for(IChartDependentChartObject obj : new IChartDependentChartObject[]{rectangle, line}){
            obj.setStickToCandleTimeEnabled(false);
            obj.setColor(color);
            obj.setOpacity(0.3f);
        }
        line.setLineWidth(3f);

        chart.add(rectangle);
        chart.add(line);
    }
    //...
}
| Attachments: |
CustomFeedCandles.java [4.44 KiB]
Downloaded 326 times
|
|
DISCLAIMER: Dukascopy Bank SA's waiver of responsability - Documents, data or information available on
this webpage may be posted by third parties without Dukascopy Bank SA being obliged to make any control
on their content. Anyone accessing this webpage and downloading or otherwise making use of any document,
data or information found on this webpage shall do it on his/her own risks without any recourse against
Dukascopy Bank SA in relation thereto or for any consequences arising to him/her or any third party from
the use and/or reliance on any document, data or information found on this webpage.
|
|
|
|
|
|
|
|
ccadar
|
| Post subject: Re: CustomCandleIndicator for 100 Tickbars - help needed |
Post rating: 0
|
Posted: Tue 02 Sep, 2014, 19:11
|
|
User rating: 3
Joined: Mon 05 Nov, 2012, 11:56
Posts: 80
Location: Germany,
|
wow fantastic code!  thanks a lot Support!! One more question, I'm thinking of defining another TickBarFeedDescriptor for the BID price as well, would it be possible to get both the BID and ASK bars at the same time into onFeedData function so that both BID and ASK bars would be available in sync as an input for the drawCandle function? something like this :
public IFeedDescriptor feedDescriptorASK = new TickBarFeedDescriptor(Instrument.EURUSD, TickBarSize.valueOf(200), OfferSide.ASK);
public IFeedDescriptor feedDescriptorBID  = new TickBarFeedDescriptor(Instrument.EURUSD, TickBarSize.valueOf(200), OfferSide.BID);

drawCandle((IPriceAggregationBar)feedDataASK, ((IPriceAggregationBar) feedDataASK).getEndTime(),  (IPriceAggregationBar)feedDataBID, ((IPriceAggregationBar) feedDataBID).getEndTime());
I have a little algo which combines both BID and ASK prices into one price. Thank you
|
|
|
|
|
|
|
API Support
|
| Post subject: Re: CustomCandleIndicator for 100 Tickbars - help needed |
Post rating: 0
|
Posted: Wed 03 Sep, 2014, 08:35
|
|
User rating: ∞
Joined: Fri 31 Aug, 2007, 09:17
Posts: 6139
|
ccadar wrote: that both BID and ASK bars would be available in sync as an input for the drawCandle function? Both of the ITimedData elements will arrive in the IFeedListener.onFeedData almost simultaneously, but they will be in 2 different listener calls, thus: - You can save the first ITimedData in Map<Long, ITimedData> map, i.e., map.put(feedData.getTime(), feedData).
- When the other ITimedData arrives with the same timestamp you fetch the other feed element from the map, i.e., map.get(feedData.getTime()).
- You will know which feedData is of ASK and which of BID by checking the feedDescriptor element.
|
|
|
|
|
|
|
ccadar
|
| Post subject: Re: CustomCandleIndicator for 100 Tickbars - help needed |
Post rating: 0
|
Posted: Wed 03 Sep, 2014, 10:15
|
|
User rating: 3
Joined: Mon 05 Nov, 2012, 11:56
Posts: 80
Location: Germany,
|
Thanks again! Another small problem... I cannot get rid of the text with numbers close to rectangle objects which makes the chart pretty ugly. Is there a function to disable that label ? (see attachement) 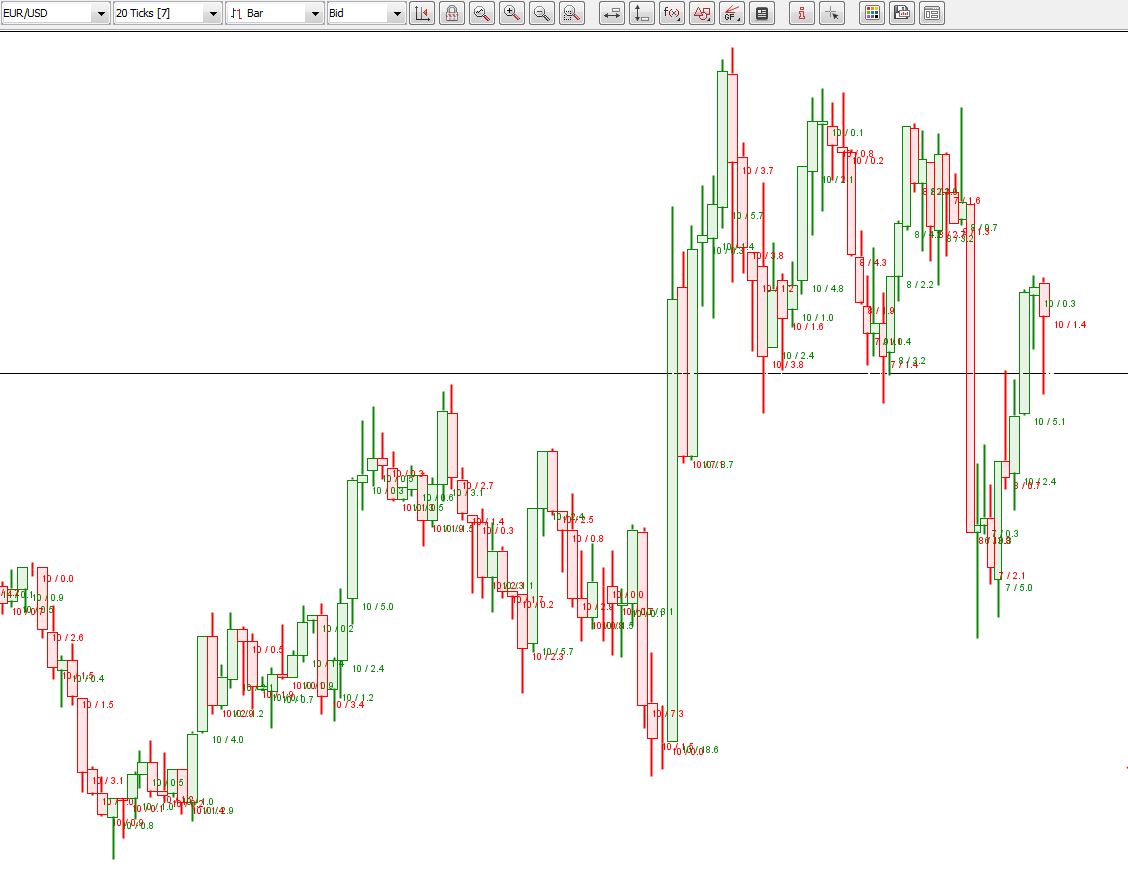
| Attachments: |
recttext.JPG [94.73 KiB]
Downloaded 980 times
|
|
DISCLAIMER: Dukascopy Bank SA's waiver of responsability - Documents, data or information available on
this webpage may be posted by third parties without Dukascopy Bank SA being obliged to make any control
on their content. Anyone accessing this webpage and downloading or otherwise making use of any document,
data or information found on this webpage shall do it on his/her own risks without any recourse against
Dukascopy Bank SA in relation thereto or for any consequences arising to him/her or any third party from
the use and/or reliance on any document, data or information found on this webpage.
|
|
|
|
|
|
|
|
API Support
|
| Post subject: Re: CustomCandleIndicator for 100 Tickbars - help needed |
Post rating: 0
|
Posted: Wed 03 Sep, 2014, 13:20
|
|
User rating: ∞
Joined: Fri 31 Aug, 2007, 09:17
Posts: 6139
|
Consider replacing the rectangle with a poly-line, but the disadvantage is that you can't fill the poly-line. If the coordinate label is really disturbing, please create a feature request in our forum.
|
|
|
|
|
|
|
ccadar
|
| Post subject: Re: CustomCandleIndicator for 100 Tickbars - help needed |
Post rating: 0
|
Posted: Wed 03 Sep, 2014, 14:12
|
|
User rating: 3
Joined: Mon 05 Nov, 2012, 11:56
Posts: 80
Location: Germany,
|
API Support wrote: Consider replacing the rectangle with a poly-line, but the disadvantage is that you can't fill the poly-line. If the coordinate label is really disturbing, please create a feature request in our forum. Thanks but I have had another idea: - set rectangle color to the background color(making it invisible) and set its opacity to zero. - use IFillableChartObject to fill the rectangle with RED/GREEN color and set its opacity to 1: for(IChartDependentChartObject obji : new IChartDependentChartObject[]{rectangle}){
obji.setOpacity(0);
obji.setColor(Color.WHITE);
IFillableChartObject ofill= ( IFillableChartObject) obji;
ofill.setFillOpacity(1);
if( bar.getClose() > bar.getOpen())
ofill.setFillColor(Color.GREEN);
else
ofill.setFillColor(Color.RED);
}
P.S: I still don't understand why we cannot use a rectangle with a clear body only with those labels..that should be changed IMO. Thanks once again for your help!
|
|
|
|
|
|
|
ccadar
|
| Post subject: Re: CustomCandleIndicator for 100 Tickbars - help needed |
Post rating: 0
|
Posted: Wed 21 Oct, 2015, 16:01
|
|
User rating: 3
Joined: Mon 05 Nov, 2012, 11:56
Posts: 80
Location: Germany,
|
|
Hello Support,
Could you please describe me how you draw the candelsticks on the Jforex Tickbar chart? This solution with polylines are not working because the Tickbar candlesticks are popping up at irregular time intervals as opposed to 1 minute candlesticks for instance, thus their bodies will have a certain variations in the width. Your tickbar candlesticks are too perfect in Jforex chart.
Can I find somewhere the java code for drawing Tickbar candlesticks in Jforex?
Thank you
|
|
|
|
|
|
|
API Support
|
| Post subject: Re: CustomCandleIndicator for 100 Tickbars - help needed |
Post rating: 0
|
Posted: Thu 05 Nov, 2015, 08:49
|
|
User rating: ∞
Joined: Fri 31 Aug, 2007, 09:17
Posts: 6139
|
It is now possible to use rectangles without labels: IRectangleChartObject.setSizeLabelEnabled(false);
|
|
|
|
|
|
|
ccadar
|
| Post subject: Re: CustomCandleIndicator for 100 Tickbars - help needed |
Post rating: 0
|
Posted: Sun 08 Nov, 2015, 07:47
|
|
User rating: 3
Joined: Mon 05 Nov, 2012, 11:56
Posts: 80
Location: Germany,
|
API Support wrote: It is now possible to use rectangles without labels: IRectangleChartObject.setSizeLabelEnabled(false); thanks for the info! I got another problem, could you please let me know how to insert some white space (pixels) between two consecutive candlesticks (rectangles) ? Thank you
|
|
|
|
|
|
|
API Support
|
| Post subject: Re: CustomCandleIndicator for 100 Tickbars - help needed |
Post rating: 0
|
Posted: Mon 09 Nov, 2015, 09:26
|
|
User rating: ∞
Joined: Fri 31 Aug, 2007, 09:17
Posts: 6139
|
That can be solved by adding time padding before and after each bar:
long timePadding = 1000;
IRectangleChartObject rectangle = chart.getChartObjectFactory().createRectangle("rect_" + bar.getTime(), bar.getTime() + timePadding, bar.getOpen(), endTime - timePadding, bar.getClose());
|
|
|
|
|
|
|
ccadar
|
| Post subject: Re: CustomCandleIndicator for 100 Tickbars - help needed |
Post rating: 0
|
Posted: Mon 11 Jan, 2016, 14:41
|
|
User rating: 3
Joined: Mon 05 Nov, 2012, 11:56
Posts: 80
Location: Germany,
|
|
Hi Support,
Could you please give me a hint how to call the CustomCandleIndicator within this strategy in order to make use of its drawCandle function instead of drawing rectangles which have scaling problems and look pretty ugly.
Perhaps I need to adjust the CustomCandleIndicator as well a little bit....
Thanks
|
|
|
|
|
|
|
API Support
|
| Post subject: Re: CustomCandleIndicator for 100 Tickbars - help needed |
Post rating: 0
|
Posted: Tue 12 Jan, 2016, 09:08
|
|
User rating: ∞
Joined: Fri 31 Aug, 2007, 09:17
Posts: 6139
|
|
Could you, please, rephrase the question?
|
|
|
|
|
|
|
ccadar
|
| Post subject: Re: CustomCandleIndicator for 100 Tickbars - help needed |
Post rating: 0
|
Posted: Tue 12 Jan, 2016, 10:41
|
|
User rating: 3
Joined: Mon 05 Nov, 2012, 11:56
Posts: 80
Location: Germany,
|
|
The "CustomCandleIndicator.java" indicator makes use of Graphics2D class so that I don't have scaling problems with the candlestick drawn by this indicator but this indicator does not work with 100 Tickbars input. I would like to extend this indicator to work with 100 Tickbars as well. Could you please give me some hints how to do that?
Thank you
|
|
|
|
|
|
 
|
Pages: [
1
]
|
|
|
|
|