Could Dukascopy Support or any volunteer try this simple strategy that prints Trend envelopes from chart and from API
your jForex chart preference Filter must be set to ALL_FLATS
I have detected this bug, where the two diverges, I have cleared my cache but that doesn't fix it, so is anyone able to reproduce it?
public class ST implements IStrategy {
    private IEngine engine;
    private IConsole console;
    private IHistory history;
    private IContext context;
    private IIndicators indicators;
    private IUserInterface userInterface;
    private IChartObjectFactory factory;
    private IChart chart;

    Period period = Period.THIRTY_MINS;
    Instrument instrument = Instrument.EURUSD;
    int supertrendPeriod = 15;
    double supertrendDev = 0.25;

    public void onStart(IContext context) throws JFException {
        this.engine = context.getEngine();
        this.console = context.getConsole();
        this.history = context.getHistory();
        this.context = context;
        this.indicators = context.getIndicators();
        this.userInterface = context.getUserInterface();

        chart = context.getChart(instrument);

        if (chart!=null){
            factory = chart.getChartObjectFactory();
            chart.add(indicators.getIndicator("TrendEnvelopes"), new Object[]{supertrendPeriod, supertrendDev});
        }
    }


    public void onAccount(IAccount account) throws JFException {
    }

    public void onMessage(IMessage m) throws JFException {
    }

    public void onStop() throws JFException {
    }

    public void onTick(Instrument instrument, ITick tick) throws JFException {
    }


    int lines=0;

    public void onBar(Instrument instrument, Period p, IBar a, IBar b) throws JFException {
        if (p == period){

            double[][] st = indicators.trendEnv(instrument, period, OfferSide.BID, supertrendPeriod, supertrendDev, Filter.ALL_FLATS, 1, b.getTime(), 0);


            if (chart!=null){
               if (!Double.isNaN(st[0][0])){
                IShortLineChartObject o2=factory.createShortLine("q"+lines,
                        b.getTime(),
                        st[0][0],
                        b.getTime()+period.getInterval(),
                        st[0][0] );
                o2.setColor(Color.CYAN);
                chart.add(o2);
               }else{
                   IShortLineChartObject o2=factory.createShortLine("q"+lines,
                        b.getTime(),
                        st[1][0],
                        b.getTime()+period.getInterval(),
                        st[1][0] );
                o2.setColor(Color.RED);
                chart.add(o2);
               }
                lines++;
            }


        }
    }

}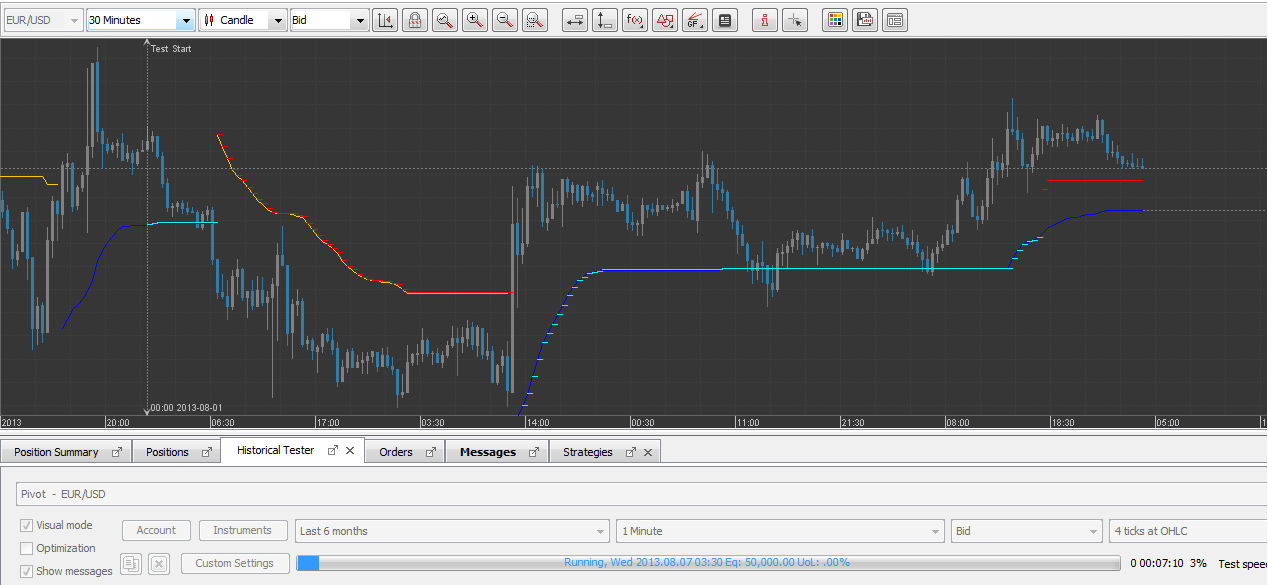
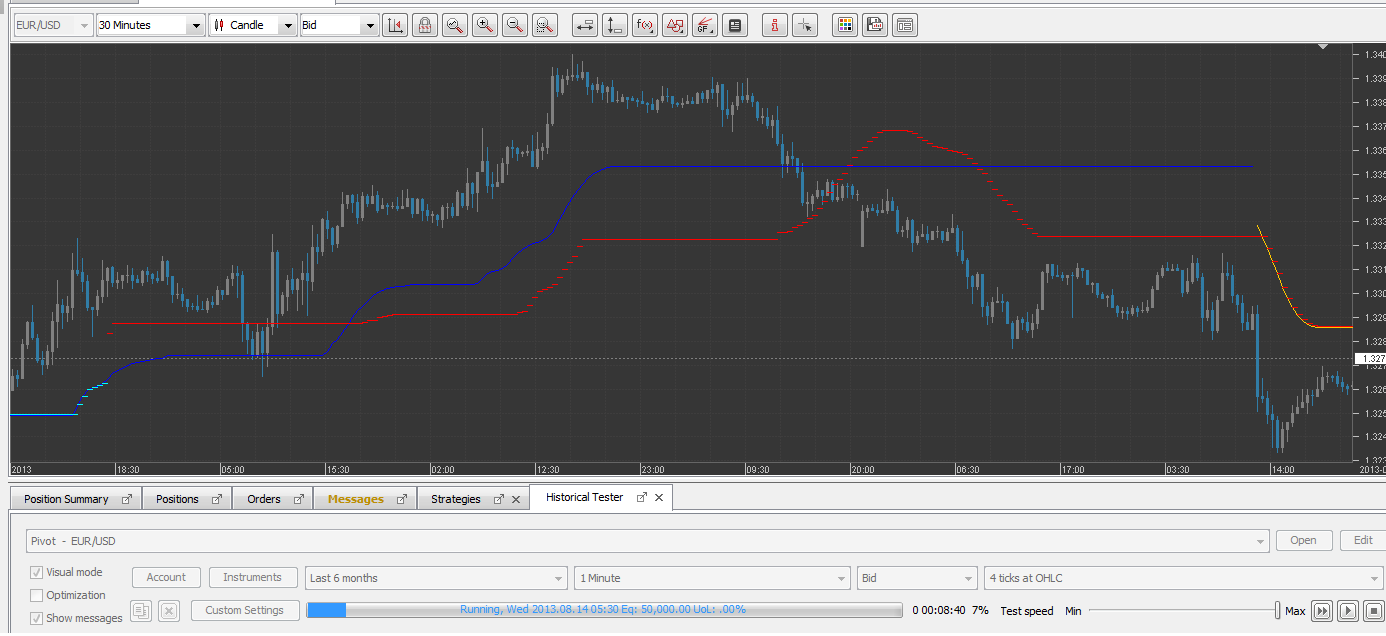
huge divergence ^ the high band is given by the API whereas on Chart the low band is still there
I just tried from another demo account, all cache cleared again

